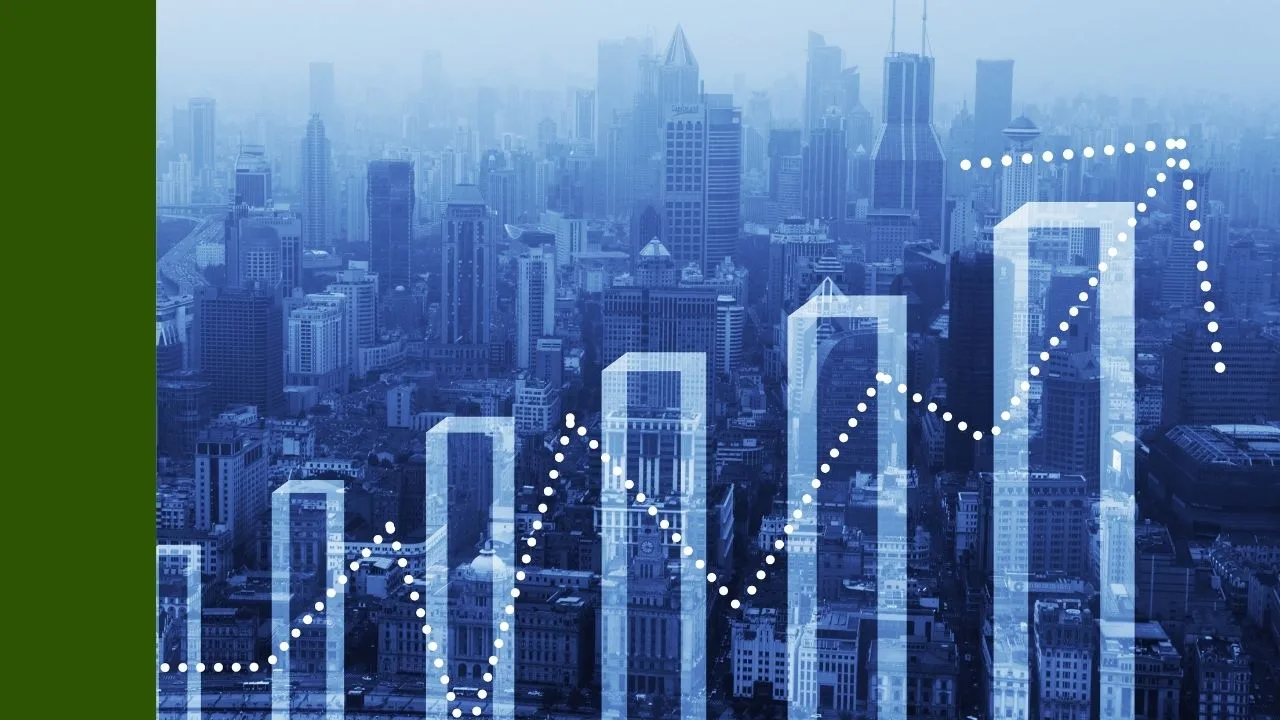
How to start trading stocks as a beginner?
Starting to trade stocks as a beginner means opening a regulated brokerage account, funding it with money you can afford to lose, and buying shares of companies you understand through a simple buy-and-hold approach. The most practical first step is choosing a commission-free online broker with a user-friendly platform, no minimum deposit, and strong educational resources. Begin with a small amount, such as $50 to $200, to learn market mechanics without significant financial risk. Use limit orders to control purchase prices, focus on 5 to 10 diversified, well-established companies, and commit to holding them for at least a year while you study how markets move. Avoid margin, options, and short selling until you have at least six months of consistent, profitable experience with basic investing. This foundational approach prioritizes learning over immediate profit and builds the discipline required for long-term success.
UNDERSTANDING WHAT STOCK TRADING ACTUALLY MEANS
Stock trading involves buying and selling shares, which represent fractional ownership in a publicly listed company. When a share price rises, the value of the holding increases; when it falls, the value decreases. Beginners often confuse trading with investing. Investing typically means buying and holding for years, focusing on company fundamentals and long-term growth. Trading implies more frequent buying and selling, often based on technical analysis or short-term price movements. For a beginner, the safest and most educational path is to start as an investor, not an active trader. This reduces transaction costs, emotional stress, and the likelihood of losses caused by inexperience.
CHOOSING A BROKERAGE ACCOUNT
The first concrete action is selecting a broker. A broker acts as the intermediary that executes buy and sell orders on a stock exchange. Key criteria for a beginner-friendly broker include: regulation by a reputable authority, such as the SEC in the U.S., the FCA in the UK, or ESMA in Europe; commission-free trading on stocks and ETFs; no account minimums; a clean mobile app and web interface; and access to educational content like articles, videos, and webinars. Examples of brokers that commonly meet these criteria include Charles Schwab, Fidelity, and E*TRADE in the U.S., and eToro, Trading 212, or Interactive Brokers internationally. Opening an account typically requires identity verification, such as a passport or driver's license, and linking a bank account for transfers. The process is digital and can be completed in under an hour.
FUNDING THE ACCOUNT AND MANAGING RISK
Deposit only money that is not needed for essential living expenses, emergency savings, or near-term goals like rent or tuition. A starting amount of $100 is sufficient to buy fractional shares of many large companies. Fractional shares allow investors to own a portion of a high-priced stock, such as buying 0.1 of a share priced at $1,000 for $100. This enables diversification even with a small account. The core risk principle is that stock prices can and do decline, sometimes sharply. A 20% drop in a $500 portfolio means a $100 loss, which is manageable. A 20% drop in a $50,000 portfolio funded with borrowed money is financially devastating. Never use money you cannot afford to lose entirely.
PLACING THE FIRST TRADE: MARKET ORDERS VS. LIMIT ORDERS
A market order buys or sells immediately at the best available current price. It guarantees execution but not price. In fast-moving markets, the price paid can differ from the last quoted price. A limit order sets a maximum purchase price or minimum sale price. It guarantees price but not execution. For a beginner, a limit order is the safer tool. For example, if a stock is trading at $150 and volatility is high, placing a limit order at $150 ensures you do not pay more than that amount, even if the price briefly spikes to $152. The trade-off is that the order may not fill if the price moves away. This discipline prevents overpaying and teaches patience.
WHAT TO BUY: A BEGINNER'S STOCK SELECTION FRAMEWORK
Beginners should focus on companies with these characteristics: a business model that is easy to understand, a history of profitability, a strong competitive position, and a market capitalization above $10 billion (large-cap stocks). Examples include household names in consumer goods, technology, healthcare, and financial services. Avoid penny stocks, which are shares trading below $5 and often suffer from low liquidity, high volatility, and a higher risk of fraud. Avoid chasing "hot tips" from social media or forums. Instead, use a simple checklist before buying:
- Can you explain what the company does in one sentence?
- Has it been profitable for at least the last three years?
- Does it have a recognizable brand or competitive advantage?
- Is the stock price reasonable relative to its earnings, or is it extremely overvalued?
This checklist filters out speculative bets and keeps the focus on quality.
BUILDING A DIVERSIFIED PORTFOLIO
Diversification means spreading investments across different companies and sectors to reduce the impact of any single stock's poor performance. A beginner with $500 might buy fractional shares of five companies, allocating roughly $100 to each, across sectors like technology, healthcare, consumer staples, financials, and industrials. This prevents a scenario where a 50% drop in one stock wipes out half the portfolio. Exchange-traded funds (ETFs) are an even simpler diversification tool. An S&P 500 ETF, for example, holds shares of 500 large U.S. companies in a single security. Buying one share of such an ETF provides instant diversification and is an excellent starting point for a first purchase.
WORKED EXAMPLE: A $200 FIRST INVESTMENT
Assume a beginner opens a brokerage account and deposits $200. They decide to buy fractional shares of two companies and one ETF. They place three limit orders:
1. $80 into a large-cap technology company trading at $160 per share, buying 0.5 shares with a limit order at $160.
2. $70 into a consumer staples company trading at $70 per share, buying 1 share with a limit order at $70.
3. $50 into an S&P 500 ETF trading at $400 per share, buying 0.125 shares with a limit order at $400.
The total invested is $200, plus any negligible exchange fees. The portfolio now holds three different assets across two sectors and a broad market index. The beginner commits to holding these positions for at least 12 months, reviewing quarterly earnings reports and price movements to learn how news affects stock prices. This approach minimizes trading costs, reduces emotional decision-making, and builds a foundation of real-world experience.
THE HOLDING PERIOD AND THE POWER OF PATIENCE
A minimum one-year holding period serves multiple purposes. It aligns with long-term capital gains tax rates in many jurisdictions, which are lower than short-term rates. More importantly, it forces the beginner to experience market cycles. Stocks fluctuate daily, weekly, and monthly. Watching a position decline 10% and recover over six months teaches emotional resilience. Selling during a dip locks in a loss; holding allows recovery. This lesson cannot be learned from books alone. The one-year rule also discourages overtrading, which generates fees, taxes, and poor timing decisions.
AVOIDING ADVANCED TOOLS UNTIL READY
Margin accounts allow borrowing money from the broker to buy more stock, amplifying both gains and losses. A 50% decline in a stock bought with 50% margin wipes out the entire investment. Options are derivative contracts that can expire worthless, causing a 100% loss of the premium paid. Short selling involves borrowing shares to sell them, hoping to buy them back cheaper; losses are theoretically unlimited because a stock price can rise indefinitely. These tools are inappropriate for beginners. The guideline is to trade only with cash, in a cash account, for at least six months of consistent, profitable decision-making before even paper trading advanced strategies.
EDUCATIONAL RESOURCES AND NEXT STEPS
While holding the initial portfolio, a beginner should study. Free resources include broker-provided tutorials, SEC investor education materials, and reputable financial news sites. Key concepts to learn include reading a balance sheet and income statement, understanding price-to-earnings ratios, and recognizing the impact of interest rates and economic data on stock prices. After six to twelve months, if the beginner has consistently made informed, unemotional decisions and understands the risks, they can consider expanding into ETFs, dividend stocks, or a paper trading account to practice more active strategies without real money. The goal is to build competence before complexity.
What is the S&P 500 index?
The S&P 500 is a stock market index that measures the performance of 500 large publicly traded companies in the United States. It is widely regarded as the best single gauge of the US equity market, covering about 80% of available market capitalization. The index is market-capitalization-weighted, meaning larger companies have a greater influence on its movements. Investors cannot buy the index directly but can gain exposure through index funds, ETFs, and futures contracts. Its value is calculated using a proprietary divisor that adjusts for corporate actions, ensuring continuity over time. Because of its broad diversification and long history, the S&P 500 serves as a benchmark for countless portfolios and a barometer of US economic health.
What Is the S&P 500?
The Standard & Poor's 500, commonly called the S&P 500, is a float-adjusted market-capitalization-weighted index. It includes 500 leading companies listed on US exchanges, selected by a committee based on market cap, liquidity, sector representation, and financial viability. The index was launched in 1957, though its precursor dates back to 1923. Today it is maintained by S&P Dow Jones Indices. The S&P 500 is not a list of the 500 largest US companies; the committee may exclude stocks that do not meet criteria such as profitability or adequate float, and it may include companies slightly smaller than some excluded ones to maintain sector balance.
How the Index Is Constructed
Eligibility requires a market cap of at least $14.6 billion (as of 2024 guidelines), positive earnings in the most recent quarter and over the trailing four quarters, high trading liquidity, and a public float of at least 10% of shares outstanding. The index is reconstituted quarterly and rebalanced as needed, but changes are infrequent. When a company is added or removed, the divisor is adjusted so the index level does not jump simply because of the change.
Understanding Market-Cap Weighting
Market-cap weighting means each company’s influence is proportional to its size. A company with a $2 trillion market cap will move the index 10 times more than a $200 billion company, assuming the same percentage price change. This contrasts with price-weighted indices like the Dow Jones Industrial Average, where a high stock price gives more weight regardless of company size. The S&P 500 uses float-adjusted market cap, counting only shares available for public trading, not those held by insiders or governments. This better reflects the investable opportunity set.
The Index Calculation and Divisor
The index level is computed as:
Index Level = (Sum of float-adjusted market caps of all constituents) / Divisor
The divisor is a proprietary number that is adjusted for stock splits, dividends, rights offerings, and constituent changes. As of early 2025, the divisor is roughly 8.5 billion, but it changes frequently. Without the divisor, the index would be a huge number in the trillions. The divisor scales it down to a readable level (e.g., around 5,000–6,000 in early 2025). When a company is replaced, the divisor is recalculated so the index value remains continuous.
Sectors and Concentration Risk
The S&P 500 is divided into 11 sectors according to the Global Industry Classification Standard (GICS): Information Technology, Health Care, Financials, Consumer Discretionary, Communication Services, Industrials, Consumer Staples, Energy, Utilities, Real Estate, and Materials. Technology has grown to dominate, often exceeding 25% of the index. The top 10 stocks, which have included Apple, Microsoft, Amazon, Nvidia, and Alphabet, can account for over 30% of the index’s total weight. This concentration means that a sharp move in a few mega-cap tech stocks can drive the entire index, even if most other stocks are flat. For example, if the top five stocks fall 5% in a day while the rest are unchanged, the S&P 500 could decline by roughly 1.5% solely from those names. This is a key risk for passive investors who may think they are diversified but are heavily exposed to a handful of companies.
How to Invest in the S&P 500
Investors cannot buy the index itself, but they can buy products that track it. The most common are:
- Index mutual funds: e.g., Vanguard 500 Index Fund (VFIAX), which holds all 500 stocks in proportion to their weight.
- ETFs: e.g., SPDR S&P 500 ETF (SPY), iShares Core S&P 500 ETF (IVV), and Vanguard S&P 500 ETF (VOO). These trade like stocks on exchanges and have low expense ratios.
- Futures contracts: E-mini S&P 500 futures (ES) and Micro E-mini futures (MES) allow leveraged exposure and are used by institutional traders and speculators. Futures involve margin and can amplify losses.
- Options on the index or on SPY/SPX provide leveraged bets or hedging.
Why the S&P 500 Matters
The S&P 500 is the primary benchmark for US equity performance. Most actively managed large-cap funds compare themselves to it. It is also a leading economic indicator: sustained declines often precede recessions, though not always. The index’s long-term annualized total return (including dividends) has been about 7–10% after inflation, but this is a historical average and not a guarantee. It is used in the calculation of the VIX volatility index, in retirement planning assumptions, and as the underlying for trillions of dollars in derivatives.
A Worked Example: Apple’s Impact
Assume the total float-adjusted market cap of the S&P 500 is $40 trillion. Apple’s float-adjusted market cap is $3 trillion. Apple’s weight is 3/40 = 7.5%. If Apple’s stock price rises 2% in a day while all other stocks are unchanged, the index would rise by 7.5% × 2% = 0.15%. If the index was at 5,000, that adds 7.5 points. In reality, other stocks move simultaneously, but this shows how a single giant can sway the index. The same math applies to declines, magnifying downside risk.
Risks and Considerations
- Concentration risk: As noted, a few stocks dominate. A tech sector downturn can pull the whole index down.
- Passive investing feedback loops: Massive inflows into S&P 500 index funds may inflate valuations of the largest stocks, creating a self-reinforcing cycle that could reverse sharply.
- Leverage and derivatives: Futures and options offer leverage, which can multiply losses beyond the initial investment. A 1% index move against a leveraged position can wipe out capital quickly.
- No guarantee of returns: The index can experience prolonged drawdowns (e.g., 2000–2002 dot-com crash, 2008 financial crisis). Past performance does not predict future results.
- Currency risk for foreign investors: If you invest from outside the US, a strengthening dollar can reduce returns in your home currency.
- Dividend inclusion: Total return versions include reinvested dividends. Price return indices exclude them, understating long-term gains.
For most long-term investors, a low-cost S&P 500 index fund is a core holding, but understanding its construction and risks helps set realistic expectations. It is not a complete portfolio; international stocks, bonds, and other assets provide additional diversification. Always consider your own risk tolerance, time horizon, and financial goals before investing.
What is an ETF and how does it work?
An exchange-traded fund (ETF) is a pooled investment vehicle that holds a diversified basket of assets such as stocks, bonds, commodities, or real estate, and trades on a stock exchange just like a single company share. Instead of buying 500 different stocks to mimic the S&P 500, an investor can buy one share of an S&P 500 ETF and gain exposure to all 500 companies in a single transaction. The share price of an ETF fluctuates throughout the trading day based on supply and demand, and a mechanism called creation and redemption keeps the market price tethered closely to the net asset value of the underlying holdings. This structure delivers the instant diversification of a mutual fund with the intraday trading flexibility, transparency, and often lower costs of a stock.
HOW AN ETF IS BUILT AND MAINTAINED
An ETF is created through a process involving a fund sponsor, authorized participants (APs), and the secondary market. The sponsor designs the fund, sets its investment objective, and files a regulatory plan. An AP, typically a large financial institution, acquires the underlying securities in the correct proportions and delivers them to the fund in exchange for a block of new ETF shares called a creation unit, often 50,000 shares. The AP can then sell those shares on the open market to retail and institutional investors. When selling pressure pushes the ETF price below the value of its holdings, the AP buys ETF shares on the open market, redeems them with the fund for the underlying basket, and sells those individual securities for a profit. This arbitrage loop keeps the ETF market price within a tight band of its net asset value.
TYPES OF ETFs
ETFs span a wide spectrum of strategies and asset classes. The most common categories include:
- Broad market index ETFs: Track major benchmarks such as the S&P 500, FTSE 100, or MSCI World. These are typically market-cap weighted and passively managed.
- Bond ETFs: Hold government, corporate, municipal, or high-yield debt. They trade like stocks but represent a portfolio of fixed-income instruments with varying maturities.
- Sector and industry ETFs: Focus on a specific slice of the economy, such as technology, healthcare, or energy.
- Thematic ETFs: Target long-term trends like clean energy, robotics, or cybersecurity. These tend to be more concentrated and volatile.
- Commodity ETFs: Provide exposure to gold, oil, agricultural products, or a basket of futures contracts. Some physically hold the commodity, while others use derivatives.
- Currency ETFs: Track the performance of a single foreign currency or a basket against a base currency.
- Inverse and leveraged ETFs: Use derivatives to deliver the opposite daily return or a multiple (2x or 3x) of an index. These reset daily and are unsuitable for holding periods longer than one session due to compounding decay.
- Active ETFs: A portfolio manager selects securities rather than tracking an index. They carry higher fees and aim to outperform a benchmark.
HOW ETF TRADING WORKS IN PRACTICE
An investor opens a brokerage account, searches for the ETF ticker, and places an order type such as market, limit, or stop. Because ETFs trade on exchanges, they offer real-time pricing, margin eligibility, and the ability to short sell. An investor buying a share of the Vanguard FTSE All-World UCITS ETF (ticker VWRL) at 09:45 GMT pays the prevailing ask price plus any brokerage commission or spread. That single share represents fractional ownership in thousands of companies across dozens of countries. Dividends received from the underlying stocks are either distributed to shareholders as cash or automatically reinvested, depending on the ETF structure. Accumulating ETFs reinvest dividends internally, which can simplify tax reporting in certain jurisdictions, while distributing ETFs pay cash.
WORKED EXAMPLE: COST COMPARISON
Consider an investor with £5,000 who wants exposure to the US stock market. Buying individual shares in 50 large US companies would incur 50 separate commissions and require significant capital to achieve balanced weightings. Alternatively, the investor could buy shares of a low-cost S&P 500 UCITS ETF with an ongoing charge figure (OCF) of 0.07% per year. The annual cost on £5,000 would be £3.50. If the index rises 8% over the year, the investment grows to approximately £5,400 before fees, a net gain of roughly £396.50. The same exposure through an actively managed US equity fund with a 1.5% annual fee would cost £75 per year, reducing the net gain to £325. Over a decade, the compounding difference between a 0.07% fee and a 1.5% fee on a £5,000 initial investment assuming 7% annual returns is roughly £1,100 in favor of the ETF. This example uses hypothetical returns and does not predict future performance.
ETF LIQUIDITY AND BID-ASK SPREADS
An ETF has two layers of liquidity: the trading volume of the ETF shares on the exchange and the liquidity of the underlying securities. Even a low-volume ETF can be highly liquid if its underlying holdings are liquid, because APs can create or redeem shares on demand. The true cost of trading an ETF is the bid-ask spread plus any premium or discount to net asset value. A major S&P 500 ETF might have a spread of 0.01%, while a niche thematic ETF could have a spread of 0.50% or more. Investors should check the average spread and avoid trading near market open or close when spreads can widen.
TAX AND REGULATORY CONTEXT
Tax treatment depends on the investor's country of residence and the ETF domicile. In the UK, ETFs are typically subject to capital gains tax on profits above the annual exempt amount and stamp duty reserve tax on purchases of UK-domiciled ETFs. Many European investors use Ireland-domiciled ETFs for favorable double-taxation treaty benefits on US dividends. In the United States, ETFs generally generate fewer capital gains distributions than mutual funds because of the in-kind creation and redemption mechanism. Tax rules change and investors should consult a qualified adviser before making decisions based on tax assumptions.
RISKS AND DRAWBACKS
ETFs carry market risk, meaning the value of the fund can fall if the underlying assets decline. Specific risks include tracking error, where the ETF return deviates from the index due to fees, sampling, or dividend timing. Synthetic ETFs use swaps to replicate an index and introduce counterparty risk if the swap provider fails. Leveraged and inverse ETFs suffer from volatility decay and can lose value even if the underlying index moves sideways over time. Niche or low-asset ETFs face closure risk, where the sponsor liquidates the fund, forcing investors to realize gains or losses at an inopportune time. Currency-hedged ETFs add a layer of complexity and cost that may not suit long-term investors. Finally, the ease of trading ETFs can tempt investors to overtrade, eroding returns through commissions, spreads, and behavioral mistakes.
ETF SELECTION CHECKLIST
When evaluating an ETF, consider these factors:
- Investment objective: Does the ETF match the desired exposure?
- Underlying index or strategy: Understand what the fund actually holds.
- Assets under management: Larger funds tend to have tighter spreads and lower closure risk.
- Ongoing charge figure: Compare fees across similar products.
- Replication method: Physical (full or sampling) versus synthetic.
- Income treatment: Accumulating or distributing.
- Domicile and tax implications: Relevant for cross-border investors.
- Tracking difference: The real-world return gap versus the index, available in fund factsheets.
- Liquidity metrics: Average daily volume and bid-ask spread.
ETFs have reshaped how individuals and institutions access financial markets by lowering costs, increasing transparency, and providing flexible tools for building diversified portfolios. Understanding the mechanics, costs, and risks allows an investor to use them effectively as core building blocks or tactical instruments.
What is a hedge fund?
A hedge fund is a private, actively managed investment partnership that pools capital from accredited investors and institutional backers to pursue absolute returns using flexible strategies. Unlike mutual funds, hedge funds can short sell, use leverage, trade derivatives, and invest across almost any asset class. The goal is to generate positive returns in both rising and falling markets, but this freedom comes with higher fees, limited liquidity, and substantial risk of loss.
HOW HEDGE FUNDS DIFFER FROM MUTUAL FUNDS
Mutual funds are publicly offered, highly regulated, and typically aim to beat a benchmark like the S&P 500. They must price daily, allow redemptions on demand, and face restrictions on short selling and leverage. Hedge funds are private placements, often structured as limited partnerships, and are only open to qualified investors. They can lock up capital for months or years, charge performance fees, and trade without the same disclosure requirements. This structure lets managers act on concentrated ideas, illiquid assets, and complex trades that mutual funds cannot execute.
COMMON HEDGE FUND STRATEGIES
Hedge funds are not a single asset class; they are defined by their strategies:
- Long/Short Equity: Buying undervalued stocks while shorting overvalued ones to isolate stock-specific returns and reduce market exposure.
- Global Macro: Taking directional bets on currencies, interest rates, commodities, and equity indices based on economic trends.
- Event-Driven: Trading around mergers, acquisitions, bankruptcies, or restructurings to capture price dislocations.
- Relative Value: Exploiting pricing inefficiencies between related securities, such as convertible bonds and the underlying stock.
- Quantitative: Using algorithms and statistical models to identify patterns across thousands of instruments.
A WORKED EXAMPLE: LONG/SHORT EQUITY TRADE
Imagine a hedge fund manager believes Company A is undervalued and Company B, a close competitor, is overvalued. The fund buys $1 million of Company A shares and simultaneously shorts $1 million of Company B shares. The gross exposure is $2 million, but the net market exposure is near zero, making the trade market-neutral. Over the next quarter, Company A rises 10% and Company B falls 5%. The long position gains $100,000. The short position profits $50,000 because the manager sold borrowed shares at a higher price and bought them back cheaper. Total gain is $150,000 on $2 million of deployed capital, a 7.5% return. However, if the manager is wrong and Company A falls while Company B rises, losses can be magnified, especially if leverage is used. For instance, if the fund borrowed an additional $1 million to double the position sizes, the same adverse move could wipe out a large chunk of capital.
THE "2 AND 20" FEE MODEL
Hedge funds typically charge a management fee and a performance fee. The classic structure is "2 and 20": a 2% annual management fee on assets under management and a 20% performance fee on profits, often above a high-water mark or hurdle rate. For a $100 million fund, the manager collects $2 million per year regardless of performance. If the fund returns 15% ($15 million profit), the performance fee is 20% of that, or $3 million. Total fees of $5 million reduce the investor's net return to 10%. Some funds charge higher fees, while others have moved to lower structures like "1.5 and 15" or even "0 and 30" with a higher performance share. High fees mean the manager must generate significant alpha just to match a low-cost index fund.
RISKS AND LEVERAGE
Leverage is a double-edged sword. Borrowing to amplify positions can turn a 1% market move into a 5% or 10% gain or loss. Many hedge funds use leverage through margin loans, derivatives, or repurchase agreements. If a trade moves against the fund, losses can exceed the initial investment, and lenders may demand additional collateral, forcing the fund to sell assets at the worst time. Liquidity risk is another major concern. Hedge funds often impose lock-up periods (e.g., one year) and only allow redemptions quarterly or annually with notice periods of 30 to 90 days. During a crisis, managers may suspend redemptions entirely to avoid fire sales, trapping investor capital. Counterparty risk arises when the fund trades derivatives with a bank that might fail. Operational risk includes fraud, as seen in high-profile blow-ups where managers misstated valuations or ran Ponzi schemes. Regulatory risk is lower than for mutual funds, but the SEC still requires hedge fund advisers to register and disclose certain information, and rules can change.
WHO CAN INVEST?
Hedge funds are restricted to accredited investors: individuals with a net worth over $1 million (excluding primary residence) or annual income above $200,000 ($300,000 jointly) for the past two years, plus institutions like pension funds, endowments, and family offices. Minimum investments often range from $100,000 to $1 million or more. This barrier is meant to ensure investors can bear the risk of total loss. Even for qualified investors, hedge funds should represent only a small portion of a diversified portfolio.
PRACTICAL CHECKLIST FOR EVALUATING A HEDGE FUND
- Manager Track Record: How long has the manager been running the strategy? What is the audited performance net of fees?
- Strategy Transparency: Does the manager clearly explain how returns are generated? Avoid black boxes.
- Risk Management: What are the maximum drawdown limits? How is leverage controlled? Is there an independent risk officer?
- Liquidity Terms: What is the lock-up period? How much notice is required for redemptions? Are there gates or side pockets?
- Fee Structure: Are fees aligned with long-term performance? Is there a high-water mark to prevent double-charging?
- Service Providers: Are the auditor, prime broker, and administrator reputable and independent?
- Regulatory Status: Is the fund registered with the appropriate authorities? Check for disciplinary history.
KEY TAKEAWAYS
Hedge funds offer sophisticated strategies that can generate returns uncorrelated with traditional markets, but they come with high fees, illiquidity, and the potential for significant losses. The flexibility to short sell, use leverage, and trade derivatives allows managers to pursue absolute returns, yet these tools amplify risk. Only accredited investors who understand the trade-offs and can afford to lose their entire investment should consider allocating capital. Due diligence is essential, and a hedge fund investment should complement, not dominate, a well-diversified portfolio.
What is a dividend and how does it work?
A dividend is a cash payment a company makes to its shareholders from its profits, typically on a regular schedule. When a corporation earns money, its board of directors decides whether to reinvest those earnings into the business or distribute a portion to investors. To receive a dividend, you must own the stock before the ex-dividend date. The payment is usually expressed as a fixed dollar amount per share, and it represents a direct return on your investment separate from any share price gains.
How Dividends Work: Key Dates
Four dates govern every dividend payment. The declaration date is when the board announces the dividend amount, the ex-dividend date, the record date, and the payment date. The ex-dividend date is the most critical for investors. If you buy shares on or after this date, you will not receive the upcoming dividend; the seller gets it. The record date is the day the company checks its shareholder register to determine who is entitled to the payment. Because stock trades take two business days to settle (T+2) in most markets, the ex-dividend date is set one business day before the record date. The payment date is when the cash actually lands in your brokerage account.
Types of Dividends
Most dividends are cash dividends, paid directly to your account. Some companies issue stock dividends, where you receive additional shares instead of cash. A special dividend is a one-time payment, often larger than usual, distributed when a company has excess cash from an asset sale or an exceptionally profitable period. Preferred stock dividends work differently: they are fixed payments that must be paid before any dividends on common stock, and they often accumulate if skipped.
Dividend Yield and How to Calculate It
The dividend yield tells you how much income you earn relative to the share price. The formula is:
Annual Dividend Per Share / Current Share Price = Dividend Yield
For example, if a stock trades at $50 and pays a $0.50 quarterly dividend, the annual dividend is $2.00. The yield is $2.00 / $50 = 0.04, or 4%. Yields fluctuate as share prices move. A rising yield can signal a falling share price, not necessarily a better income opportunity.
Worked Example
Suppose Company ABC declares a quarterly cash dividend of $0.60 per share. The key dates are:
- Declaration date: April 1
- Ex-dividend date: April 14
- Record date: April 15
- Payment date: April 30
An investor owning 300 shares before April 14 will receive 300 x $0.60 = $180 on April 30. If the share price is $30 on April 13, the annual dividend is $2.40, giving a yield of 8%. On the ex-dividend date, the stock price typically opens lower by roughly the dividend amount, all else being equal, because the company's cash reserves decrease. In this case, the price might adjust to around $29.40. The investor still has the $180 cash and the shares, but the total portfolio value remains similar, ignoring market movements.
Dividend Payment Schedules
Most dividend-paying companies in the US pay quarterly. Some pay monthly, such as certain real estate investment trusts (REITs) and business development companies (BDCs). European and Asian companies often pay semi-annually or annually. The schedule is set by the board and can change.
Why Companies Pay Dividends and Why They Cut Them
Mature, profitable companies with limited growth opportunities often return cash to shareholders via dividends. It signals financial health and disciplined capital allocation. Growth companies typically reinvest all profits and pay no dividend. A dividend cut or suspension usually indicates financial trouble. A high payout ratio (dividends as a percentage of earnings) above 80-90% can be unsustainable. Investors should examine free cash flow and earnings stability, not just the yield.
Risks and Important Considerations
Dividends are not guaranteed. A company can reduce or eliminate its dividend at any time. Chasing high yields without analyzing the underlying business can lead to "dividend traps" where a high yield results from a collapsing share price.
Leverage and margin amplify these risks. Buying dividend stocks on margin means you pay interest on the loan. If the share price falls, you face a margin call, and the dividend income may not cover the interest cost. Short selling around dividends carries a specific obligation: if you are short a stock over the ex-dividend date, you must pay the dividend amount to the lender of the shares. This is called a "dividend payment in lieu" and can create a sudden cash outflow.
CFDs (contracts for difference) do not grant ownership of the underlying stock, so you do not receive a real dividend. Instead, brokers make a cash adjustment to your account. For long CFD positions, you may receive a dividend adjustment, but for short CFD positions, the adjustment is deducted. These adjustments can be subject to different tax treatments and may not perfectly match the actual dividend.
Crypto staking rewards are sometimes called dividends, but they are fundamentally different. Staking involves locking up tokens to validate network transactions and earning new tokens as rewards. These rewards carry smart contract risk, slashing risk, and price volatility. They are not corporate profit distributions and are often treated as income at the time of receipt for tax purposes.
Tax on dividends varies widely by country. Some jurisdictions tax dividends as ordinary income, others at a lower qualified dividend rate, and some not at all. Tax wrappers like ISAs (UK) or IRAs (US) can shelter dividends from tax. Always consult a qualified tax professional for your situation.
Practical Checklist for Dividend Investors
- Confirm the ex-dividend date before buying.
- Check the payout ratio and free cash flow coverage.
- Look at the dividend growth history, not just the current yield.
- Understand sector risks: REITs, utilities, and energy companies often have high yields but face interest rate or commodity price sensitivity.
- If using leverage, calculate the net return after interest costs.
- For short selling, mark ex-dividend dates on your calendar to avoid unexpected payments.
- Consider total return: share price appreciation plus dividends, not yield alone.
- Review tax implications in your country of residence.
Dividends can be a reliable component of long-term total return, but they require the same due diligence as any other investment. A disciplined approach that looks beyond the headline yield and accounts for key dates, payout sustainability, and personal tax circumstances will serve investors better than simply buying the highest-yielding names.
What is an IPO and how to invest in one?
An IPO, or initial public offering, is the process where a private company sells shares to public investors for the first time and becomes listed on a stock exchange. After an IPO, investors can buy and sell the company's shares through the public market, usually on exchanges such as the NYSE or Nasdaq. IPOs can create opportunities, but they are also risky because the company may have a limited public track record, valuation can be aggressive, and early trading can be very volatile.
How an IPO works
Before an IPO, a company is usually owned by founders, employees, venture capital funds, private equity firms, and early private investors. To go public, the company hires investment banks to underwrite the offering, files a registration statement with regulators, publishes a prospectus, markets the deal to institutional investors, and sets an offering price before trading begins.
The prospectus is the key document. It explains what the company does, how it makes money, its financial statements, risk factors, planned use of proceeds, major shareholders, executive compensation, and legal issues. For a US IPO, investors usually review the S-1 filing. This document matters more than headlines because it shows the business model and risks in the company's own disclosures.
IPO price vs opening trade
The IPO price is the price set before shares begin public trading. Retail investors often do not receive shares at that price. When trading opens, the stock may open above, below, or near the IPO price depending on demand. For example, if an IPO is priced at $20 but opens at $28, an investor buying at the open is not buying at the IPO price. They are buying in the secondary market at a 40 percent higher price. If the stock later falls to $22, the company can still be above its IPO price while the retail buyer is losing money.
Ways to invest in an IPO
The first route is direct IPO allocation through a broker. Some brokers offer access to selected IPOs, but allocations are not guaranteed. Popular IPOs are often heavily oversubscribed, and large institutions may receive most of the shares. If a retail investor receives an allocation, they should still read the prospectus and understand any restrictions, fees, or eligibility rules.
The second route is buying after the stock starts trading. This is the most common route for retail investors. It is simpler, but it means the investor is buying at the market price, not necessarily the IPO price. The first hours and days can be extremely volatile because early investors, institutions, short-term traders, and market makers are all reacting to limited public trading history.
The third route is indirect exposure through funds. Some ETFs and mutual funds own newly public companies or growth stocks that recently listed. This can reduce single-company risk, but it also means the investor has less control over which IPOs they own.
What to check before investing
Start with revenue growth, profitability, cash flow, and debt. A fast-growing company is not automatically a good investment if losses are widening and the valuation already assumes years of strong execution. Look at gross margin, operating margin, customer concentration, and whether the company depends on one product, one geography, or one partner.
Next, compare valuation. Common valuation metrics include price-to-sales, price-to-earnings if the company is profitable, enterprise value-to-revenue, and free cash flow yield. The right metric depends on the business. A software company, bank, retailer, and biotech firm should not be judged with the same shortcut.
Then read the risk factors. IPO filings often list risks that are easy to ignore during hype cycles: slowing growth, competition, regulatory exposure, customer churn, supply chain problems, dual-class voting rights, pending lawsuits, or dependence on key executives.
Also check the lock-up period. Many IPOs have a lock-up period, often around 180 days, during which insiders and early investors cannot sell some or all of their shares. When the lock-up expires, extra supply can enter the market. That does not guarantee the stock will fall, but it is a date investors should know.
Main risks
IPO investing carries market risk, valuation risk, liquidity risk, and information risk. There may be less public history than with mature listed companies. Early trading can be driven by sentiment rather than fundamentals. Some IPOs perform well for years, but many underperform after the initial excitement fades.
A practical approach
Beginners should avoid treating IPOs as guaranteed quick wins. Use limit orders rather than market orders during volatile openings, keep position sizes small, compare the IPO with already public competitors, and decide in advance whether the investment is a short-term trade or a long-term holding. If the only reason to buy is hype, scarcity, or fear of missing out, the risk is usually higher than it feels.
The simple rule is this: an IPO is not automatically cheap because it is new. It is worth considering only when the business quality, valuation, growth prospects, and risk profile make sense at the price you can actually buy.