Commodity Markets
Metals, energy, and agriculture prices with latest analysis

Valero Energy (VLO) GF Score 66 Points to Valuation, Momentum Weakness
GuruFocus GF Score of 66 out of 100 flags poor future outperformance potential for Valero Energy. Low GF Value and momentum ranks suggest limited margin of safety. Renewable fuel growth offers an offset.

BP Shares Rise 3.5% After $8B Debt Cut, Dividend Safety in Focus
BP cut net debt by $8B in Q3, hitting a 2027 target. Shares rose 3.5% to $48.74, supporting the 4.11% dividend. The stock trades above its GF Value.
KOSPI -6% Sell-Off Hits ASX Tech, Materials Slide on Lithium Drop
A steep 6% drop in South Korea's KOSPI pulled the Australian tech index XTX down 4% on Tuesday, raising the risk of spillover into US markets, traders said.

Truist Raises CHRD Target to $195 as Bakken Consolidation Thesis Tests
AlphaScala GF Value prices CHRD at a 10% discount to its $144.85 price. Insider selling diverges from analyst conviction. Q3 Bakken report is the test.
Technip Energies Lands HPCL Refinery Upgrade Worth Up to €500M
Technip Energies wins HPCL's Mumbai Refinery EPC job for up to €500M, with shares 21.1% below GuruFocus' GF Value and the contract set to enter the Q3 2026 backlog.

India's ₹1,620 Cr Base Oil Refinery Targets Import Dependence
Modi launched a ₹1,620 crore base oil refinery in Chennai, part of ₹13,000 crore projects. The LOBS unit could reduce India's reliance on imported Group II/III base oils from South Korea and the Middle East.

Panama Quake Losses May Top $1 Billion After 7.7 Shock
Panama's strongest quake since 1951 hit Friday, forcing an airport evacuation and halting metro lines. Aftershocks above magnitude 4.8 continue.

Gold Miners Surge 3.2% as Financials Lead Broad Rally
Gold miners jumped 3.2% and financials rose 0.9% ahead of bank earnings. JPMorgan (Alpha Score 49) and Wells Fargo (46) report Tuesday. Humana surged 16.3%; Apple dropped 2.6%.

U.S Gold Corp (NASDAQ:USAU) joins Terminal1 platform
The gold explorer will use Terminal1's integrated shareholder intelligence and investor communications tools to replace fragmented IR systems, the company said Oct. 9.

Kerala High Court FIR Puts CMRL at Center of Fraud Probe
A Kerala High Court order registering an FIR over ED allegations directly exposes mineral sands processor CMRL to a criminal probe for alleged fraudulent payments.

De Beers Taps Botswana Basket Weavers to Bolster Natural Diamond Branding
De Beers backs Botswana master weaver Shakunona Parata at Homo Faber 2026, linking natural diamond provenance to craft traditions ahead of a Frieze Masters commission in October.

BHP Divests Kambalda Nickel to Gold Fields as WA Suspension Drags
BHP shares fell over 1% after it agreed to sell the Kambalda Nickel Concentrator and tenements to Gold Fields, as the miner continues its retreat from nickel amid a global oversupply.

Halliburton Exits Falklands Sea Lion Project on Argentine Pressure
Halliburton exits the Sea Lion oil project near the Falkland Islands after Argentine President Milei tightens sovereignty enforcement. The 1.7 billion-barrel field loses a key contractor.
Hindalco, AluChem Scrap Specialty Alumina Deal on Extended Delays
Hindalco and AluChem scrap specialty alumina deal with no penalty. HDFC Bank CEO, DLF sell-out, Ola pledge, Gland Pharma deal also in focus.
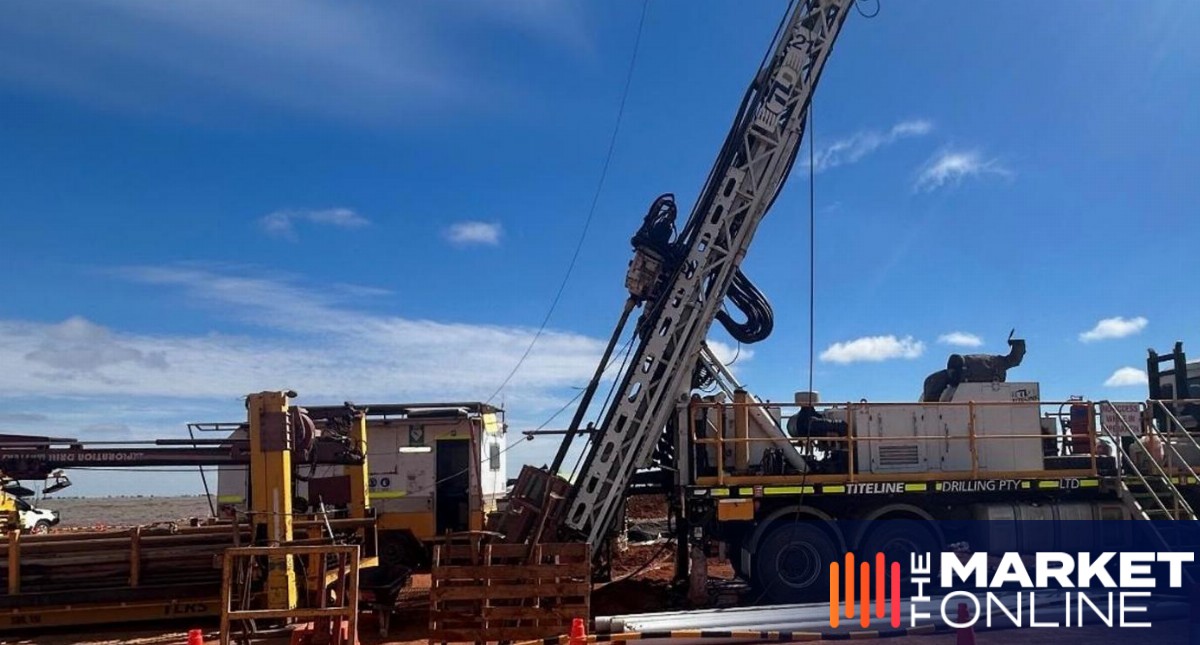
Red Hill Minerals kicks off 1,700m drill program at Broken Hill
Red Hill Minerals starts 1,700m diamond drilling at Furiosa copper-gold and Dementus lead-zinc-silver targets, testing for BHT-style mineralisation after 2025 surveys refined the structural model.
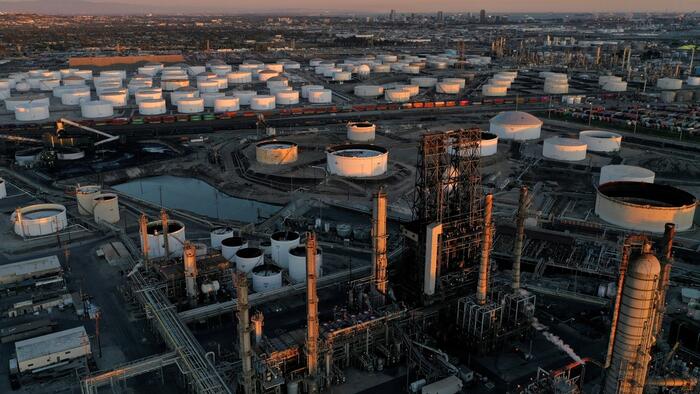
US Refinery Shrinkage Leaves Fuel Supply With Thin Cushion
US refinery capacity is shrinking as aging plants shut down, narrowing the cushion between fuel demand and production. The analysis says eight new refineries would be needed to restore a safe margin.

Jio Platforms IPO at $143-146B valuation likely by month-end
Jio Platforms expected to list by end-October at $143-146B enterprise valuation, sources say. The $3.8B IPO, India's largest, follows overseas roadshows led by Akash Ambani.

How to Value Aristocrat and Santos Using Simple Multiples
Aristocrat's price-to-sales ratio of 5.38x sits below its five-year average; Santos's trailing yield of 4.35% is close to its historical norm. Two quick valuation checks for ASX investors.

Telstra's Stable Yield vs Mineral Resources' Profit Slump in FY24
Telstra's FY24 debt/equity ratio stood at 99.4% with a 3.6% dividend yield, while Mineral Resources saw revenue grow 12.2% but net profit slump to $125m.
XLE ETF Sells $29M Chevron, $10.8M ConocoPhillips in Sector Pullback
State Street's Energy Select Sector SPDR shed $121M on Sept. 30, trimming Chevron, ConocoPhillips, and Valero. The ETF's largest sales signal a sector rebalance.
What affects gold prices?
Gold prices move on four main forces: real interest rates, the U.S. dollar, geopolitical fear, and central bank buying. That is the short answer. The longer answer digs into how each force works and why traders watch them. **Real interest rates** Real interest rates are nominal yields minus expected inflation. When the 10-year Treasury yield is 4.5% and inflation expectations sit at 2.5%, the real yield is 2.0%. Gold has no yield. It competes with bonds that do. Higher real yields make bonds more attractive relative to gold. Lower real yields do the opposite. Traders watch the 10-year TIPS yield as a proxy. A drop in TIPS yields often lifts gold. A rise pushes gold down. This relationship broke down briefly in 2022 when both real yields and gold rose together, but over the long run it holds. **The U.S. dollar** Gold is priced in dollars. A stronger dollar makes gold more expensive for buyers using other currencies. That reduces demand. A weaker dollar does the opposite. The correlation is not perfect. Gold can rally alongside a strong dollar during a crisis, but the typical pattern is inverse. Traders track the DXY index. When DXY falls, gold often rises. When DXY climbs, gold tends to slip. **Geopolitical fear and safe-haven flows** Wars, sanctions, banking crises, and political instability push money into gold. Investors treat it as a store of value when systems look fragile. The 2008 financial crisis, the 2020 pandemic, and the 2022 Russia-Ukraine invasion all saw gold spike. The move is usually sharp and short. Once the panic fades, gold often gives back the gains. Traders watch news headlines and volatility indexes like the VIX. A sudden VIX jump can trigger a gold bid within hours. **Central bank buying** Central banks buy gold to diversify reserves away from the dollar. China, India, Turkey, and Poland have been large buyers in recent years. The People's Bank of China added gold for 10 straight months through April 2024. These purchases create a floor under prices. They do not cause daily swings, but they matter over quarters and years. Traders track central bank gold reserve data from the IMF and the World Gold Council. **A practical scenario** Imagine a trader sees the 10-year TIPS yield drop from 1.8% to 1.5% over a week. The dollar index also falls from 105 to 103. No major war breaks out. The trader checks central bank buying data and finds China added another 10 tonnes. The trader might buy gold, expecting the real yield and dollar tailwinds to push prices higher. The risk is that the Fed surprises with a hawkish statement, sending real yields and the dollar up, crushing the gold trade. Stop-losses and position sizing matter. **Key terms** Real yield: nominal bond yield minus expected inflation. TIPS: Treasury Inflation-Protected Securities, bonds whose principal adjusts with inflation. DXY: the U.S. Dollar Index, measuring the dollar against six major currencies. COMEX: the primary futures exchange for gold in New York. Central bank reserves: foreign currency and gold holdings managed by a nation's monetary authority. **Risk context** Gold is not a guaranteed safe haven. It can fall 20% in a month when real rates rise fast. Leveraged products like gold futures, CFDs, and gold ETFs on margin amplify losses. A 10% gold drop can wipe out a 5x leveraged position. Short selling gold carries unlimited risk if the price spikes. Crypto gold tokens carry counterparty risk from the issuer. Tax treatment varies by jurisdiction. Gold held for less than a year is often taxed as short-term capital gains. Always know the instrument and the leverage before trading. **One more factor: supply and mining costs** Gold production is relatively stable at about 3,000 tonnes per year. Mining costs average around $1,200 per ounce. That sets a rough floor. If gold falls below all-in production costs, mines shut down and supply tightens. That rarely happens because gold has traded above $1,800 for most of the last five years. Supply constraints matter at the margin but are not a daily driver. **What to watch** Friday's U.S. jobs report can move gold through real rate expectations. The next Fed meeting statement matters. Any escalation in the Middle East or Ukraine can trigger a bid. Central bank gold reserve data comes out quarterly. The World Gold Council publishes demand trends every quarter. Traders who track these inputs have a clearer picture than those who just look at a chart.
What is crude oil trading?
Crude oil trading means buying and selling contracts for crude oil, the unrefined petroleum pumped from the ground. Traders do not usually take physical delivery of barrels. Instead they trade financial instruments that track the price of oil. The goal is to profit from price changes, hedge against future price moves, or gain exposure to the energy sector without owning a refinery. Crude oil comes in different grades. The two most important benchmarks are Brent and West Texas Intermediate (WTI). Brent crude comes from the North Sea and sets the price for about two thirds of the world's oil. WTI is lighter and sweeter, meaning it has lower sulfur content, and is the benchmark for US crude. Brent typically trades at a small premium to WTI because of differences in quality and transport costs. There is also Dubai/Oman crude, used as a benchmark for Middle Eastern oil sold to Asia. Where does trading happen? Most crude oil trading takes place on futures exchanges. The New York Mercantile Exchange (NYMEX) lists the WTI futures contract. The Intercontinental Exchange (ICE) lists the Brent futures contract. A futures contract is an agreement to buy or sell a fixed amount of oil at a set price on a future date. The standard contract size for WTI is 1,000 barrels. For Brent it is also 1,000 barrels. Traders can go long (betting the price will rise) or short (betting the price will fall). There is also a spot market where physical barrels change hands. But most financial traders never touch the spot market. They trade futures, options, or contracts for difference (CFDs). CFDs allow a trader to speculate on price moves without owning the underlying contract. They are popular with retail traders because they require less capital, but they come with high leverage risk. What moves crude oil prices? Supply and demand are the foundation. When global production exceeds consumption, prices tend to fall. When demand outpaces supply, prices rise. But the market reacts to expectations, not just current flows. OPEC+ decisions matter a lot. The group of oil producing countries, led by Saudi Arabia and Russia, meets regularly to set production targets. A surprise cut in output can send prices up 5% or more in a single session. An unexpected increase in supply can push prices lower. Geopolitical events also drive crude. A war in a major producing region, sanctions on Iran or Russia, or a disruption in shipping lanes like the Strait of Hormuz can cause sudden price spikes. Traders watch headlines from the Middle East, Venezuela, and Libya closely. Inventory data from the US Energy Information Administration (EIA) is released every Wednesday. A larger than expected drawdown in crude stockpiles is bullish. A build is bearish. The American Petroleum Institute (API) reports its own data a day earlier, and the market often reacts to that as well. Economic data plays a role too. Strong GDP growth in China or the US boosts demand expectations. A recession lowers them. The US dollar exchange rate matters because oil is priced in dollars. A weaker dollar makes oil cheaper for buyers using other currencies, which can lift demand and prices. A worked example Suppose a trader thinks WTI crude will rise from $75 a barrel to $80 over the next month. They buy one WTI futures contract at $75. The contract represents 1,000 barrels. If the price hits $80, the profit is $5 per barrel times 1,000, or $5,000, minus commissions and fees. If the price falls to $70 instead, the loss is also $5,000. Futures use margin, meaning the trader only puts up a fraction of the contract value as collateral. That leverage amplifies both gains and losses. Risks to know Leverage is the biggest danger. A small price move against a position can wipe out the margin deposit. CFDs and futures both carry this risk. A trader should never risk more than they can afford to lose. Oil prices can gap. They can open sharply higher or lower after a weekend event, skipping past stop loss orders. That can lead to losses larger than expected. Market timing is hard. Even professional traders get the direction wrong. The oil market is influenced by many factors that are hard to predict, from weather to political decisions. Regulatory risk also exists. Some jurisdictions restrict retail access to oil futures or CFDs. Always check local rules before trading. For beginners, the safest approach is to start with a demo account. Learn how the contracts work, how margin calls happen, and how news moves prices. Only trade with money you can afford to lose. And never chase a trade because the price is moving fast. Crude oil trading offers opportunities but comes with serious risk. Understanding the benchmarks, the exchanges, and the key price drivers is the first step. The second step is respecting the leverage and the volatility. The third is having a plan for when the trade goes against you.
What is natural gas trading?
Natural gas trading is the practice of buying and selling financial instruments whose value is derived from the price of natural gas. The primary goal is to profit from price fluctuations or to hedge against future energy costs. The global benchmark is the Henry Hub Natural Gas futures contract traded on the New York Mercantile Exchange (NYMEX). Each contract represents 10,000 million British thermal units (MMBtu), and prices are quoted in US dollars and cents per MMBtu. This market is structurally volatile because supply is slow to adjust while demand can swing dramatically based on weather. A single cold snap forecast can send prices up 10% in a day, while a mild winter can cause prices to collapse. Understanding the physical commodity, the weekly data cycle, and strict risk controls is essential for anyone entering this market. HOW THE NATURAL GAS MARKET WORKS Natural gas is a physical commodity used primarily for heating, electricity generation, and industrial processes. Unlike oil, it is difficult to store in large quantities relative to daily consumption, and transportation relies heavily on pipelines and liquefied natural gas (LNG) terminals. Supply comes from drilling operations, which cannot be ramped up or down quickly. Demand, however, is highly seasonal and weather-driven. In winter, residential and commercial heating needs spike. In summer, air conditioning loads increase gas-fired power demand. This mismatch creates sharp price swings. The Henry Hub in Louisiana serves as the delivery point for the benchmark futures contract, reflecting the price at a major pipeline intersection. Other regional hubs, such as the Dutch TTF in Europe or the Japan Korea Marker (JKM) in Asia, also have their own pricing, but Henry Hub remains the most liquid global reference. KEY INSTRUMENTS FOR TRADING NATURAL GAS Traders access natural gas markets through several instruments. Futures contracts are the most direct. One Henry Hub contract covers 10,000 MMBtu, and a move of $0.01 per MMBtu equals a $100 change in contract value. Options on futures give the right but not the obligation to buy or sell at a set price, limiting risk to the premium paid. Exchange-traded funds (ETFs) like the United States Natural Gas Fund (UNG) hold futures contracts and offer equity-like trading without a futures account, but they suffer from contango decay when futures curves slope upward. Contracts for difference (CFDs) and spread bets allow leveraged directional bets with lower capital requirements, but they carry counterparty risk and overnight funding costs. Stocks of natural gas producers, such as EQT or Cheniere Energy, provide indirect exposure, though their prices also reflect company-specific factors. Each instrument has different margin rules, liquidity, and tax treatment, so choosing the right one depends on a trader's capital, risk tolerance, and time horizon. THE WEEKLY DATA CYCLE Natural gas prices react sharply to data releases. The most important is the U.S. Energy Information Administration (EIA) Weekly Natural Gas Storage Report, released every Thursday at 10:30 a.m. Eastern Time. It shows how much gas was injected into or withdrawn from underground storage compared to the five-year average. A larger-than-expected withdrawal during winter signals strong demand and can push prices higher. A smaller-than-expected injection in summer suggests tightening supply. Weather forecasts, particularly from the Global Forecast System (GFS) and European Centre for Medium-Range Weather Forecasts (ECMWF), drive pre-report positioning. Traders also monitor the Baker Hughes rig count on Fridays for drilling activity, LNG export levels, and pipeline maintenance announcements. Missing these data points can leave a trader on the wrong side of a sudden move. WORKED EXAMPLE: A FUTURES TRADE Suppose a trader expects an early cold blast in the Northeast United States. On October 15, they buy one December Henry Hub futures contract at $3.50 per MMBtu. The notional value is 10,000 MMBtu x $3.50 = $35,000. The exchange requires initial margin of $4,000 (margin varies by broker and volatility). A week later, a revised weather model shows much colder temperatures, and the price jumps to $3.80. The trader sells to close the position. The profit is ($3.80 - $3.50) x 10,000 = $3,000, a 75% return on the $4,000 margin. However, if the forecast had flipped to mild and the price dropped to $3.20, the loss would be $3,000, wiping out 75% of the margin. Because futures are leveraged, a small adverse move can exceed the initial margin, triggering a margin call where the trader must deposit additional funds or be forcibly liquidated. This example illustrates both the opportunity and the danger. RISK MANAGEMENT AND VOLATILITY Natural gas is one of the most volatile commodities. Daily price swings of 3% to 5% are common, and during extreme weather events, moves of 10% or more can occur in a single session. Leverage amplifies these swings. A trader using CFDs with 10:1 leverage faces a 10% loss on the position for every 1% adverse price move. Gap risk is significant because markets close over the weekend while weather models update. A Monday open can gap far beyond a stop-loss order, resulting in slippage and larger-than-expected losses. For CFD and spread bet traders, overnight funding charges can erode profits on positions held for weeks. Additionally, regulatory changes, such as shifts in LNG export policy or pipeline approvals, can cause sudden repricing. Never risk more than a small percentage of total capital on any single trade, and always use a hard stop-loss. Beginners should start with small position sizes, paper trade for several weeks, and avoid holding positions through major data releases until they understand the volatility. CHECKLIST FOR NEW NATURAL GAS TRADERS - Understand the EIA storage report schedule and typical market reactions. - Monitor at least two weather models daily during the winter and summer seasons. - Check production levels, LNG feedgas demand, and pipeline flow data. - Use only risk capital that can be lost without affecting daily life. - Start with one mini or micro contract, or a small CFD position, to limit exposure. - Set a stop-loss before entering any trade and respect it. - Keep a trading journal to review what drove price moves and your decisions. - Be aware of contract expiration dates to avoid physical delivery unless intended. Natural gas trading offers significant profit potential, but it demands discipline, constant information monitoring, and a clear risk plan. The market rewards those who respect its volatility and punishes those who treat it casually.
How does OPEC affect oil prices?
OPEC affects oil prices primarily by coordinating crude oil production levels among its member countries, which directly influences global supply. When the Organization of the Petroleum Exporting Countries and its allies, collectively known as OPEC+, agree to cut output, the reduced supply tends to push prices higher if demand remains stable. When the group increases production, the added supply can drive prices lower. This mechanism works because OPEC+ nations control a large share of the world's proven oil reserves and roughly 40% of global crude output, giving them significant market weight. However, their influence is not absolute; it is constantly tested by non-OPEC production, demand fluctuations, geopolitical shocks, and member compliance levels. How the Quota System Works OPEC's core tool is a system of production quotas, or output targets, assigned to each member. These targets are negotiated during regular meetings and extraordinary sessions. A quota specifies how many barrels per day a country is allowed to pump. The collective decision to raise or lower the total ceiling sends a powerful signal to oil markets. When OPEC announces a cut, traders often bid up futures contracts in anticipation of tighter physical supply. Conversely, an increase in quotas or a failure to agree on cuts can trigger sell-offs. Real-world examples illustrate the mechanism. In April 2020, as pandemic lockdowns crushed global oil demand, OPEC+ agreed to a historic cut of 9.7 million barrels per day. This unprecedented reduction helped put a floor under prices after West Texas Intermediate futures briefly turned negative. In October 2022, OPEC+ announced a 2 million barrel per day cut, which supported prices despite recession fears. In 2023, several members announced additional voluntary cuts totaling around 1.6 million barrels per day, keeping Brent crude above $80 for extended periods. These actions demonstrate how coordinated supply management can counteract demand weakness. The Spare Capacity Buffer A critical but often overlooked factor is spare production capacity, the extra volume OPEC members can bring online quickly and sustain for a period. Saudi Arabia and the United Arab Emirates typically hold most of this buffer. When spare capacity is abundant, markets feel insulated against supply disruptions because the group can compensate for outages. When spare capacity shrinks, prices become highly sensitive to any threat to supply, such as geopolitical tensions in the Middle East or infrastructure damage. Low spare capacity amplifies OPEC's influence because the market has no safety net. Limits on OPEC's Power OPEC does not control the oil market unilaterally. Several forces constrain its power: - Non-OPEC Production: The United States, Canada, Brazil, and Norway are major producers outside the cartel. The US shale revolution transformed global supply dynamics, making America the world's largest oil producer. When OPEC cuts output to support prices, higher prices often incentivize US drillers to increase production, partially offsetting the cut. - Demand Shocks: OPEC can manage supply, but it cannot control demand. A global recession, a shift toward renewable energy, or efficiency gains can destroy oil consumption faster than OPEC can adjust. The 2020 demand collapse showed that even massive production cuts take time to rebalance the market. - Cheating on Quotas: Member compliance is voluntary and uneven. Countries facing fiscal pressure or political instability often exceed their quotas. Iraq, Nigeria, and Russia have periodically overproduced, undermining the group's credibility and diluting the price impact of announced cuts. - Geopolitics: Conflicts involving member states can disrupt supply regardless of quota agreements. Sanctions on Iran and Venezuela, unrest in Libya, or attacks on Saudi infrastructure can remove barrels from the market unexpectedly, causing price spikes that OPEC did not plan. Practical Scenario: Trading Around an OPEC Meeting A trader expects OPEC+ to announce a production cut at its upcoming meeting. Before the decision, crude oil is trading at $75 per barrel. The trader buys a futures contract or a CFD on Brent crude. OPEC+ surprises the market with a larger-than-expected cut of 1.5 million barrels per day. Prices jump to $82 within hours. The trader closes the position for a profit. However, if the group fails to agree or announces a smaller cut than anticipated, prices could drop to $70, triggering a loss. This scenario highlights the binary, event-driven risk of trading OPEC decisions. Announcements often cause rapid, gap-driven moves where slippage is common. No forecast can guarantee the outcome of a closed-door negotiation. Checklist for Analyzing OPEC's Impact Use this checklist to assess how an OPEC decision might affect oil prices: - What is the announced change in total production, measured in barrels per day? - How does the change compare to current market estimates of global supply and demand balance? - Which countries are bearing the burden of cuts, and what is their recent compliance record? - What is the current level of global spare capacity, and who holds it? - How are non-OPEC producers, especially US shale, likely to respond at the new price level? - What is the macroeconomic backdrop: growing or slowing global economy? - Are there concurrent supply disruptions from geopolitics or weather that amplify or offset the OPEC move? Risk Context for Leveraged and Derivative Products Oil prices are inherently volatile, and OPEC announcements magnify that volatility. Trading oil through CFDs, futures, or spread bets involves leverage, which amplifies both gains and losses. A sudden headline can move prices several percentage points in minutes, triggering margin calls or stop-outs. Markets can gap through stop-loss orders, resulting in losses larger than the account balance in extreme cases. Short selling oil during OPEC cuts carries the risk of a sharp rally that can theoretically produce unlimited losses. In crypto markets, oil-linked tokens or synthetic assets add counterparty risk and often suffer from low liquidity during high-volatility events. No regulatory body guarantees outcomes, and past OPEC decisions do not predict future price reactions. Only risk capital should be used, and position sizes must account for the possibility of extreme, unpredictable swings. How OPEC Affects Different Oil Benchmarks OPEC's actions influence major crude oil benchmarks differently. Brent crude, the international benchmark priced in the North Sea, is most directly affected by OPEC+ decisions because it reflects global seaborne supply. West Texas Intermediate (WTI), the US benchmark, is more influenced by domestic supply dynamics, pipeline capacity, and storage levels at Cushing, Oklahoma. OPEC cuts can widen or narrow the spread between Brent and WTI. Dubai/Oman crude, a benchmark for Asian markets, is directly tied to Middle Eastern production levels. Traders tracking OPEC should watch the Brent-WTI spread as a real-time gauge of how the market is pricing the cartel's actions relative to US supply conditions. Long-Term Structural Challenges OPEC's long-term influence faces structural headwinds. The energy transition toward renewables and electric vehicles is expected to slow oil demand growth and eventually cause it to peak. OPEC's own forecasts differ from those of the International Energy Agency, creating uncertainty. Additionally, the rise of ESG investing and climate policies in consuming nations could accelerate the shift away from fossil fuels. These trends do not eliminate OPEC's short-term pricing power but suggest that the cartel's ability to manage prices over a multi-year horizon may diminish. For traders, this means OPEC announcements will remain high-impact events, but the duration of their effect may shorten as the energy landscape evolves. Worked Example: Calculating the Supply Impact Assume the global oil market is roughly balanced at 100 million barrels per day of supply and demand. OPEC+ announces a cut of 1 million barrels per day, reducing supply to 99 million barrels per day. If demand remains at 100 million barrels per day, a daily deficit of 1 million barrels emerges. Over 30 days, global inventories would draw by 30 million barrels. Inventory draws at this scale historically correlate with upward price pressure. However, if non-OPEC producers add 400,000 barrels per day in response to higher prices, the net deficit shrinks to 600,000 barrels per day, and the price impact is smaller. This simplified arithmetic shows why traders must assess the net supply change, not just the headline cut, and why compliance and non-OPEC response matter as much as the announcement itself.
What is the difference between WTI and Brent crude?
WTI and Brent are the two most widely traded crude oil benchmarks, used as reference prices for oil contracts globally. WTI stands for West Texas Intermediate, a light, sweet crude produced primarily in the United States. Brent crude is a blend from the North Sea fields around the UK and Norway, and it serves as the global benchmark for approximately two-thirds of the world's crude oil. The main differences lie in their composition, geographic delivery points, and price dynamics. **Composition and Quality** Crude oil is classified by density (API gravity) and sulfur content. Lighter crude (higher API) yields more gasoline and diesel. Sweet crude has low sulfur, meaning less refining cost. WTI has an API gravity around 39.6 degrees (light) and sulfur content about 0.24% (sweet). Brent has an API gravity around 38 degrees (still light but heavier) and sulfur content about 0.37% (still sweet but slightly sourer). WTI is generally considered higher quality due to being lighter and sweeter. **Geographic Delivery Points** WTI is delivered at Cushing, Oklahoma, a major pipeline and storage hub in the US. Brent is delivered at the Sullom Voe terminal in the Shetland Islands, UK. The location affects pricing due to transportation costs and regional supply/demand imbalances. Cushing is landlocked, so pipeline constraints can cause price disconnects. Brent is waterborne and can be shipped globally, making it more responsive to international events. **Price Differentials** Historically, WTI traded at a slight discount to Brent due to lower transport costs to US refineries. However, from 2011 to 2014, WTI traded at a significant discount (often $10 to $20 per barrel) to Brent due to a US shale oil boom that overwhelmed Cushing storage and pipeline capacity. After pipeline expansions, the spread narrowed. Since 2015, the spread has typically been $2 to $5 per barrel, but events like the 2020 oil price war or the 2022 Russia-Ukraine conflict caused wider deviations. **Trading and Market Influence** WTI futures trade on the New York Mercantile Exchange (NYMEX) with a contract size of 1,000 barrels. Brent futures trade on the Intercontinental Exchange (ICE) in London, also 1,000 barrels. Both are highly liquid. Brent is more influenced by global supply/demand, OPEC decisions, and geopolitics, especially Middle East and Africa. WTI is more sensitive to US inventory data, pipeline flows, and US economic indicators. **Worked Example: Spread Trading** Suppose WTI is $80 per barrel and Brent is $85. The spread is $5. A trader believes the spread will narrow (WTI gains relative to Brent). The trader buys one WTI futures contract (long) and sells one Brent futures contract (short). If WTI rises to $82 and Brent rises to $86, the spread narrows to $4. The trader makes $2 per barrel on WTI (since bought at $80, sold at $82) but loses $1 per barrel on Brent (sold at $85, bought back at $86). Net profit: $2,000 from WTI (2 x 1,000) minus $1,000 from Brent = $1,000 gain. However, if the spread widens to $6, the trader would lose. Leverage in futures means small price moves cause large percentage gains or losses. Initial margin might be $5,000 per contract, so a $1,000 profit on a $10,000 margin investment is a 10% return, but a $1,000 loss would be a 10% loss. Trading oil involves risk of rapid loss. **Key Terms for Beginners** - API gravity: Measures crude density. Above 35 is light, below 35 is heavy. - Sweet vs. sour: Sweet crude has less than 0.5% sulfur, sour has more than 0.5%. - Benchmark: A reference price used for pricing other crudes. - Cushing: A major storage hub in Oklahoma, delivery point for WTI futures. - Sullom Voe: Terminal in Shetland, delivery point for Brent futures. **Risk Context** Crude oil is volatile. Prices can swing 5%+ in a day due to OPEC announcements, geopolitical tensions, or economic data. Trading futures or CFDs with leverage can amplify losses. A 10% adverse move can wipe out your entire margin. Never risk more than you can afford to lose. Always use stop-loss orders. Consider that CFDs and spread betting are banned in some jurisdictions. Consult the risk warning from your broker. **Practical Considerations** When choosing between WTI and Brent for trading, consider exposure: WTI reflects US crude dynamics, Brent reflects global seaborne crude. Many traders trade the spread (WTI vs Brent) to bet on relative strength. Both are equally liquid, but spreads may vary. For long-term positions, Brent is often preferred due to its global relevance. For short-term, WTI may react more to US inventory reports (released weekly by EIA). Always backtest a strategy before trading real capital. **Conclusion** The primary differences between WTI and Brent are their quality (WTI is lighter and sweeter), delivery location (Cushing vs. Sullom Voe), and market influence (US vs. global). These factors create a price spread that fluctuates over time. Understanding these differences helps traders select the appropriate benchmark for their strategy and manage the associated risks.
Why do people invest in silver?
People invest in silver primarily as a store of value, an industrial commodity, a portfolio diversifier, and a hedge against inflation and economic uncertainty. Silver has a dual nature: it is both a precious metal, like gold, and a critical industrial metal, used in electronics, solar panels, medical devices, and more. This duality creates unique demand drivers that often differ from gold or stocks. Understanding these reasons helps investors decide whether silver fits their goals and risk tolerance. **Store of Value and Inflation Hedge** Silver has been used as money for thousands of years. Like gold, it retains purchasing power over long periods. When paper currencies lose value due to inflation, investors often turn to tangible assets. Silver prices tend to rise during periods of high inflation or when central banks print large amounts of money. Since 1971, when the US dollar left the gold standard, silver has acted as a hedge against currency debasement, though its price can be volatile. For example, during the 1970s inflation crisis, silver surged from around $1.50 per ounce to nearly $50 per ounce by 1980. While past performance does not guarantee future results, the inflation-hedge argument remains a core reason investors hold silver. **Industrial Demand** Silver is an essential component in many modern technologies. It has the highest electrical and thermal conductivity of any metal, making it irreplaceable in circuit boards, electrical contacts, and batteries. Solar photovoltaic cells use silver paste in their construction. One solar panel can contain about 20 grams of silver. As solar energy adoption grows globally, projected to increase by over 20% per year in some regions, industrial silver demand is expected to rise. The automotive industry also uses silver in connectors, sensors, and electric vehicle components. This industrial demand creates a floor for silver prices and can drive growth during economic expansions. However, it also exposes silver to economic downturns when industrial activity slows. **Portfolio Diversification** Silver often has a low or negative correlation with stocks and bonds. Adding silver to a portfolio can reduce overall volatility and improve risk-adjusted returns. During stock market crashes, silver sometimes performs well because investors seek safe-haven assets. In 2008, after the initial crash, silver prices rebounded strongly. In 2020, during the COVID-19 market crash, silver dropped initially due to industrial concerns but then rallied to new highs alongside gold. A typical allocation to silver among precious metals might be 5% to 10% of a portfolio, though individual risk tolerance varies. **Cheaper Alternative to Gold** Silver is often called "the poor man's gold" because it is more affordable per ounce. At around $20 to $30 per ounce (depending on market conditions), smaller investors can buy physical silver coins or bars without the capital needed for gold. This accessibility makes silver a popular entry point into precious metals investing. The gold-to-silver ratio, which measures how many ounces of silver it takes to buy one ounce of gold, historically averages around 60:1 to 80:1. When the ratio is high, silver may be considered undervalued relative to gold, prompting some investors to buy silver in anticipation of a ratio decline. **Monetary and Economic Uncertainty** Silver is seen as a safe haven during geopolitical tensions, banking crises, or currency instability. When confidence in governments or financial systems erodes, demand for tangible assets rises. Silver holdings in exchange-traded products (ETPs) have grown substantially. For example, the largest silver ETF, iShares Silver Trust (SLV), held over 17,000 tonnes of silver as of 2024. This demand reflects investors seeking protection from systemic risks. **Inflation and Supply Dynamics** Silver supply is relatively inelastic in the short term. Mining production is constrained by ore grades, energy costs, and regulatory hurdles. Annual silver mining output is around 26,000 tonnes, with about 80% produced as a byproduct of copper, lead, and zinc mining. This means silver supply cannot quickly respond to price changes. Meanwhile, above-ground silver stockpiles are smaller than gold in terms of volume. The Silver Institute reports that total silver supply has declined slightly in recent years due to mine closures and lower grades. Combined with rising industrial demand, this can create supply deficits, deficits which historically have supported prices. **Worked Example: Risk and Return Trade-off** Consider an investor who bought 100 ounces of silver at $24 per ounce in January 2020, spending $2,400. By August 2020, spot silver reached $28 per ounce. The investment was worth $2,800, a gain of 16.7% in eight months. However, in March 2020 during the pandemic panic, silver dropped to $12 per ounce, a temporary loss of 50%. A stop-loss order set at $18 would have limited losses to 25%. This example shows silver's high volatility. Using leverage, such as a 5x CFD, would amplify gains to 83.5% but also losses to 250% if the price dropped to $12. Leverage magnifies risk and can lead to losses exceeding the initial deposit. **Checklist for Investing in Silver** - Determine your investment objective: hedge, growth, or diversification. - Decide on the form: physical (coins, bars), ETFs, mining stocks, or futures/CFDs. - Assess your risk tolerance. Silver can swing 10% to 20% in a month. - Allocate no more than 5% to 10% of your portfolio to avoid overexposure. - Avoid leveraged products like CFDs or futures unless you fully understand the risks. - Store physical silver securely and insure it. - Monitor the precious metals market is less regulated than stock markets, so use reputable dealers. - Monitor industrial demand trends, interest rates, and the US dollar index, as these affect silver prices. **Risk Context** Silver carries significant risks. Its price is more volatile than gold, often moving two to three times more on a percentage basis. Using leverage through CFDs or futures can lead to total loss of capital in short periods. Cryptocurrency-backed silver tokens or synthetic silver products may lack transparency and custody. Short selling silver is also risky because silver sometimes rallies sharply, especially during crises. Tax treatment varies by country. In the US, physical silver is taxed as a collectible at a maximum 28% long-term capital gains rate of 28%. Always consider storage costs for physical silver and management fees for ETFs. Past performance does not predict future results. Trading any instrument involves risk of loss. **Conclusion** People invest in silver for its dual role as money and industry metal. It offers inflation protection, portfolio diversification, and a lower-cost precious metal alternative. But its volatility, industrial dependence, and storage challenges require careful planning. No investment is guaranteed. Silver has historically performed well during economic uncertainty but can also decline sharply during recessions. Each investor must weigh these factors against their own financial situation and goals.
Everything you need for commodity trading on AlphaScala.