Stocks● Neutral
Three TASI Stocks Print 52-Week Highs on June 1
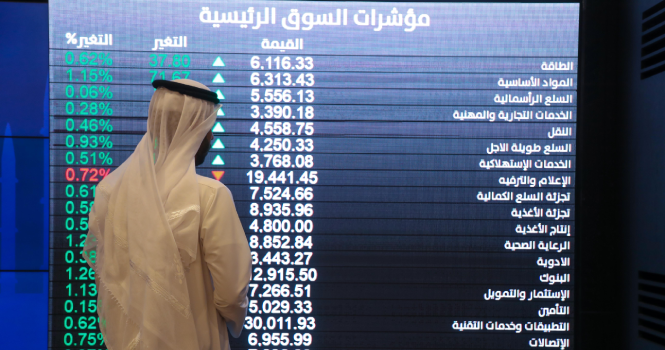
Three TASI-listed companies reached 52-week highs on June 1. The breakout raises questions about follow-through and execution risk for traders scanning Saudi stocks.
Continue with
Three stocks on the Saudi main index (TASI) hit their highest levels in 52 weeks on June 1, according to data compiled by Argaam. The milestone puts each name under a specific scrutiny: whether the breakout reflects genuine demand or a liquidity-driven spike.
What a 52-Week High Signals for TASI Stocks
A 52-week high is a technical marker that often triggers algorithmic buying and retail attention. For the three TASI-listed companies, the move does not automatically confirm a bullish trend. The better market read is to examine whether the high was accompanied by above-average volume. A low-volume breakout suggests the move may be driven by a single large order or thin liquidity, not broad conviction.
TASI itself has been trading in a range in recent weeks. When the index is flat but individual stocks print new highs, the divergence usually points to company-specific catalysts rather than a macro shift. The three stocks likely have distinct triggers – a contract win, a dividend announcement, or an earnings surprise – but the source data does not disclose those details. Traders should check each issuer’s recent filings for the catalyst.
Execution Risk and the Volume Check
A 52-week high creates execution risk. Liquidity can thin out above prior resistance, and retail traders often chase breakouts without a stop. The first test is the next session’s volume. If the stock holds above its previous resistance level (now support) on above-average volume, the breakout has a higher probability of extending. If it gaps down or trades on low volume, the high was likely a liquidity grab.