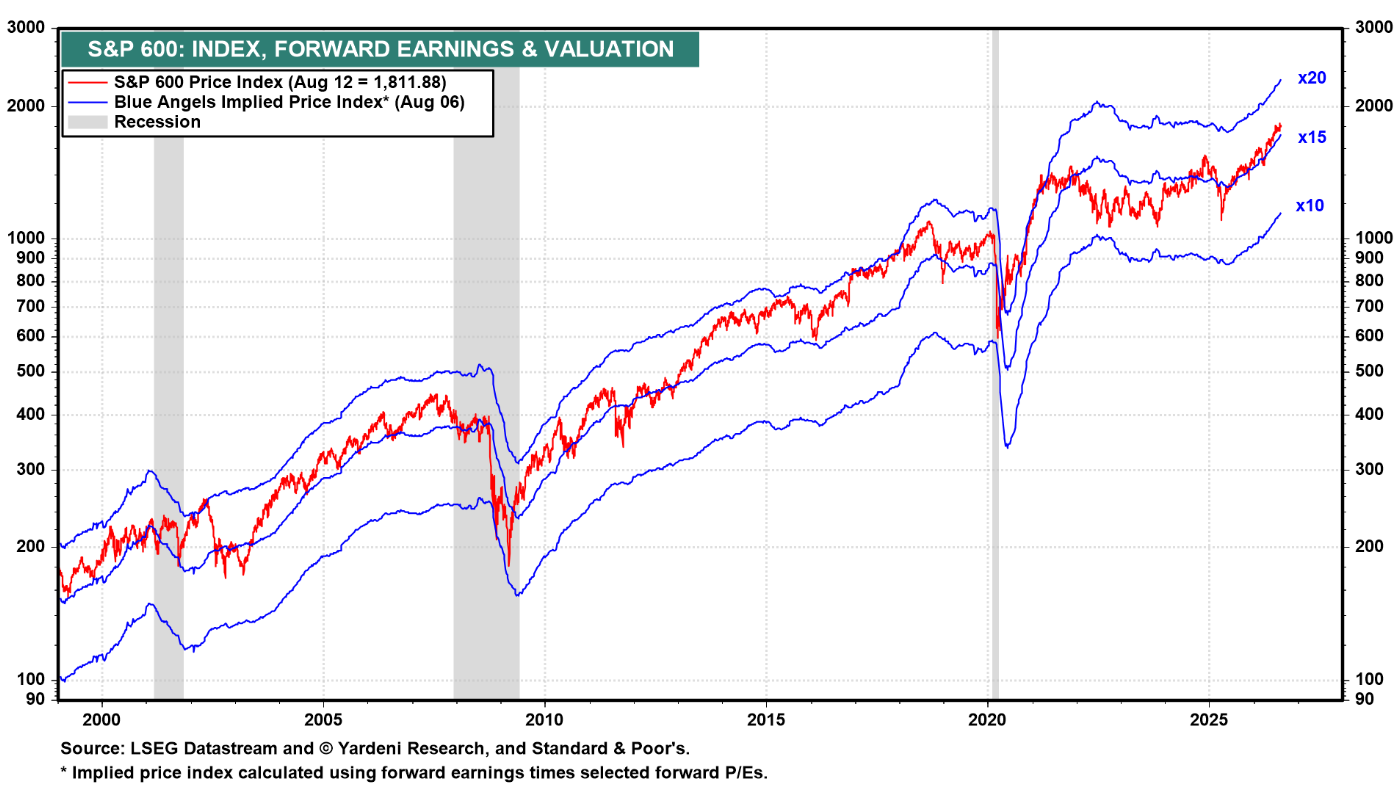
The S&P 600 small-cap index has returned 22.8% this year, nearly double the S&P 500's 12.5%. The index, which requires positive trailing earnings for inclusion, has climbed out of a four-year funk where total returns went nowhere.
Kyith, an investment analyst and founder of Investment Moats, plotted the S&P 600's forward operating earnings per share back to 1999. The chart shows an upward trajectory with recessionary dips, each followed by recovery. A stagnation period runs from roughly mid-2021 through the first half of 2025. That flat patch mirrors the price chart. Each bar in his chart represents one year.
Earnings forecasts during that stretch were first too optimistic, then too pessimistic, Kyith said. When EPS surprised to the downside, the market adjusted prices down. When it surprised to the upside, values adjusted up. The four-year funk made many doubt that small caps could produce growing earnings at all – even as interest rates stayed higher than many expected.
A three-year chart of the S&P 600 price index plotted against forward earnings and forward PE shows how closely price and earnings track each other. From time to time, prices diverge from earnings. That is when opportunity appears for investors, Kyith said.
The same index plotted against PE bands of 10, 15 and 20 times shows that the S&P 600 has often traded above 15 times earnings. Throughout the current recovery, the valuation has stayed at roughly 15 times. That suggests the market is in a mid-range, not demanding territory.
Analyst earnings growth forecasts show a pattern of early optimism followed by downward revision. For 2025, the starting forecast was about 20% growth; it ended close to 6%. For 2026, the starting forecast was about 17%, then dipped to 13% before steadying at 15%. The 2027 forecast begins at roughly 20% growth. Kyith asked whether that forecast will hold or disappoint, and answered: "How would I know?"
The S&P 600's forward PE remains near 15 times, a level that has historically been a middle ground. With earnings recovering from the funk and forecasts still uncertain, the valuation case for small caps is neither stretched nor cheap – it depends on whether the earnings growth actually arrives.
Kyith is the Owner and Sole Writer behind Investment Moats, where he covers passive and active investing strategies. He works as a Senior Solutions Specialist at Providend, a fee-only wealth advisory firm. His investment broker of choice is Interactive Brokers, which lets him invest across exchanges at low commission rates without custodian fees.