The iShares Asia Pacific UCITS Dividend ETF (IDAP) delivers a 5% distribution yield and a 20-year annualized total return of 6.5%. That sounds reasonable for an income fund. The problem is the income stream barely grows and the net asset value has gone sideways since inception.
The fund tracks the Dow Jones Asia/Pacific Select Dividend 50 Index. The methodology starts with stocks from Australia, Hong Kong, Japan, New Zealand, and Singapore, excluding REITs. Eligibility screens require each stock to pass dividend-growth and earnings-per-share thresholds. Existing constituents get a pass on those screens; only new entrants must clear them. The selection buffer allows a stock to fall to 80th place before being dropped, while a newcomer must crack the top 25 to enter. That design limits turnover.
Weighting is not simple yield-weighting. Each stock receives a “tilted” yield equal to its indicated annual dividend yield, capped at 20%, multiplied by the square root of its float-adjusted market cap. This tilts weight toward larger, more liquid names rather than letting a small, high-yielding stock dominate. Additional caps limit any single stock to under 8% and any industry group to under 22%. A daily capping check can trigger an intra-year rebalance if the combined weight of stocks above 4.8% exceeds 24%.
How has that recipe performed? Since inception, the ETF delivered a 6.5% annualized total return through May 2026. The past three years have been stronger, at over 20% annualized, and five years above 10%. Compare those numbers to the MSCI All Country Asia Pacific Index. Over the same three-year period, the broad index returned 23.2% annualized, beating the dividend fund. Over five years, the broad index returned 14.1% annualized, again ahead. The dividend ETF’s outperformance only shows up over the full history: the MSCI index managed 9.4% annualized versus 11.6% for IDAP since inception. Much of that edge came from the index’s early years. Rolling five-year periods show median returns around 2.8% a year.
Volatility is a concern. The standard deviation of monthly returns is 20%, in line with broad emerging markets. That is higher than what a developed-market Asia fund would typically deliver. The dividend screen does not smooth the ride.
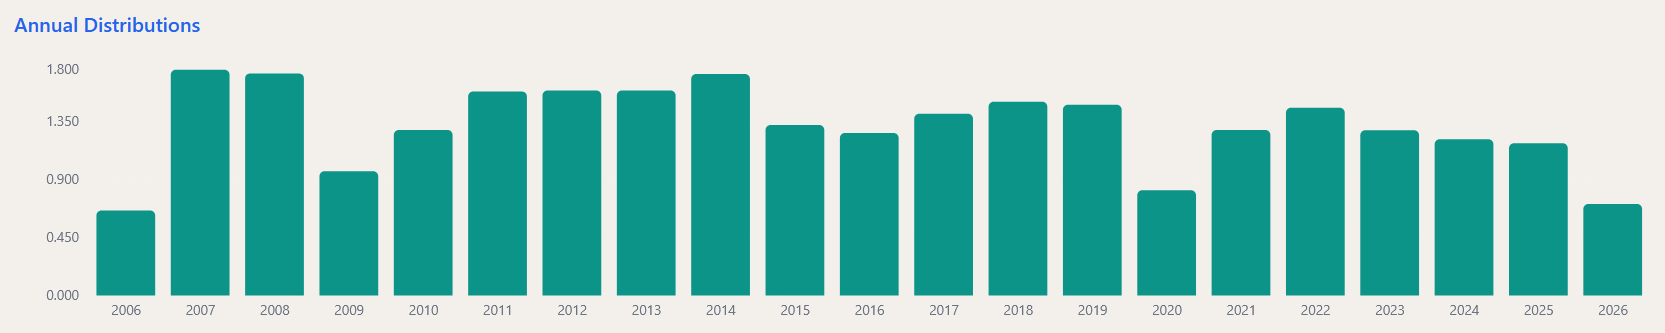
The NAV chart tells a stark story. Twenty years of data show the per-share net asset value oscillating around a flat line. The distribution has been paid quarterly. Payouts dipped after the Global Financial Crisis and again during the COVID year. They have recovered never grown reliably. For a $1 million investment in 2006, the annual income would have ranged from roughly $35,000 to $85,000, with no upward trend. The yield on initial capital started near 5% and has moved around that level.
What does this mean for an income-focused investor? The fund automates a dividend screen and rebalance strategy, the resulting portfolio behaves like a collection of high-payout-ratio stocks. Those stocks tend not to grow their dividends. The total return comes almost entirely from yield, not capital appreciation. An investor who never adds capital gets the same volatile, non-growing income stream year after year.
The trade-off is not necessarily bad. A 5% yield with moderate volatility can provide cash flow. Anyone expecting straight-line rising dividends or capital preservation in real terms will be disappointed. The fund’s design favors stability in membership, not in payouts.
Interactive Brokers (IBKR), a broker often used for international ETF access, has an Alpha Score of 72 out of 100, aligning with its strong revenue growth and efficient operations. For those considering this ETF, the IBKR platform offers competitive commission rates and access to multiple exchanges. The stock bonus for new account deposits can be a net positive, the long-term return on IDAP itself depends on accepting the flat NAV and volatile payout pattern.