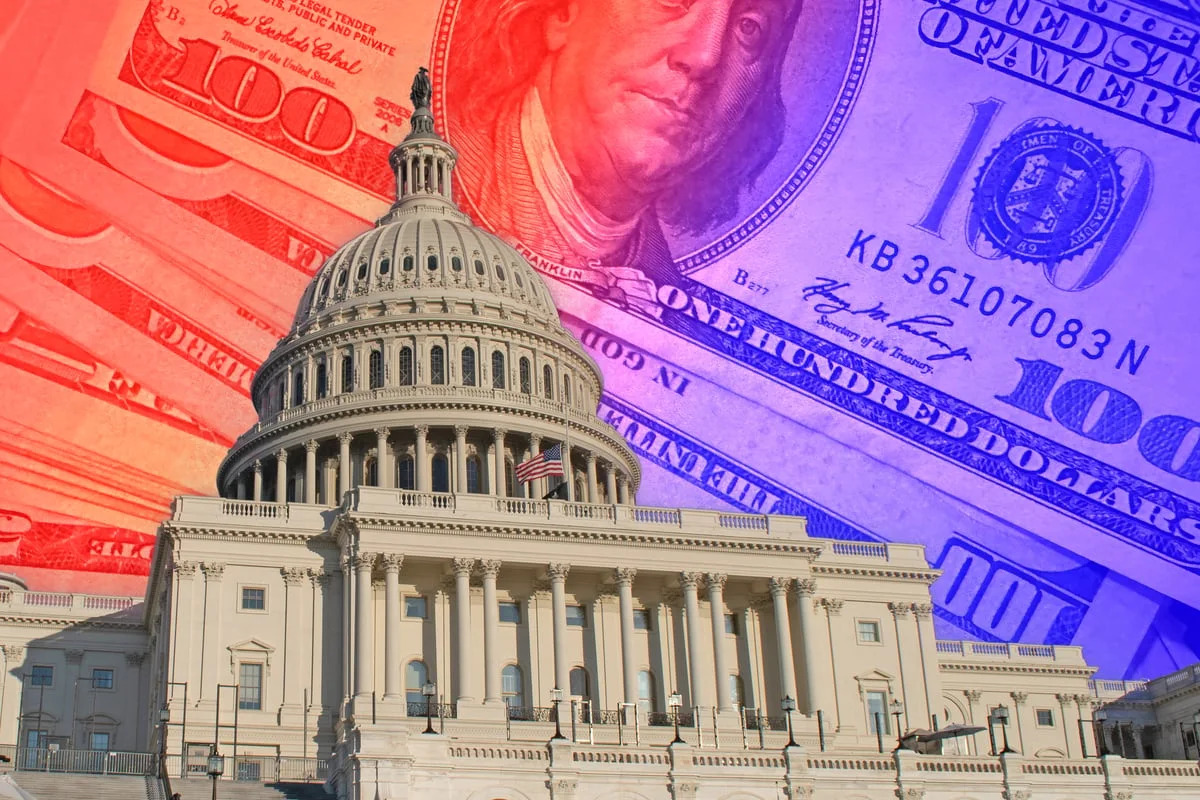
The U.S. government’s debt balance crossed $40 trillion in August, a milestone that underscores the scale of federal borrowing. The figure equals 124% of gross domestic product, up from 62% in 2006, Treasury data show. The debt has more than doubled in a decade.
Interest payments on the debt now consume a larger share of the federal budget than any category except Social Security and Medicare. The Congressional Budget Office projects gross federal debt will reach $64 trillion by 2036.
For equity markets, the rising debt load carries a dual effect. On one side, sustained government spending injects liquidity into the economy, supporting corporate earnings and asset prices. The S&P 500’s cyclically adjusted price-to-earnings ratio, or CAPE ratio, stood at 42.2 as of Aug. 20 – more than double the historical average of about 17. That level typically signals lower long-term returns, but the relationship has been distorted by years of monetary and fiscal expansion.
On the other side, the debt trajectory raises the risk of higher long-term interest rates, which would pressure equity valuations. The Federal Reserve has held its benchmark rate at 5.25%–5.5% since July 2025, but the cost of servicing the debt increases with each rate reset. If the Fed eventually cuts rates to ease the interest burden, the dollar could weaken, and inflation could accelerate.
M2 money supply has grown 81% over the past decade, while the dollar’s purchasing power has declined 28%, according to Federal Reserve data. That currency debasement has pushed investors into real assets, including stocks. The S&P 500 has returned 317% over the last 10 years, even as the CAPE ratio was already elevated at 26.7 in 2016.
Investors tracking the debt story should watch the Treasury’s quarterly refunding announcements and the CBO’s updated projections. The next refunding schedule is due Nov. 2. The 10-year Treasury yield, which influences equity risk premiums, will be the immediate transmission mechanism.
Nvidia (NVDA) shares fell 0.98% to $214.72 on Friday, with an Alpha Score of 68 on a 100-point scale, indicating moderate technical and fundamental conditions. The chipmaker’s exposure to government spending is indirect, but the broader macro backdrop of fiscal expansion and potential dollar weakness has historically been supportive for growth stocks.
For now, the $40 trillion milestone is a reminder of the structural forces shaping the market. The Fed’s next policy decision, scheduled for Sept. 17, will offer the clearest signal on how policymakers are balancing inflation control with debt-service costs.