Stocks● Neutral
TTI Signals: Domestic +9.43%, International +7.71%
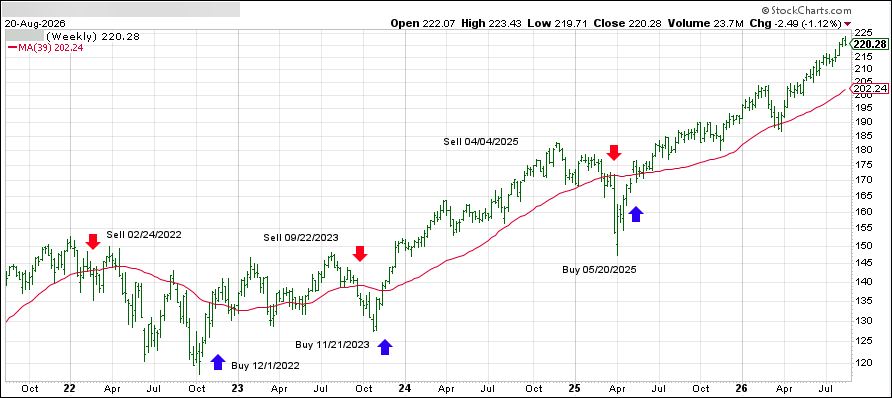
The Domestic TTI sits 9.43% above its long-term moving average; the International TTI is 7.71% above, in buy mode since May 2025. Full ETF momentum tables updated through Aug. 20.
Continue with
The Domestic Trend Tracking Index stood 9.43% above its long-term moving average as of Aug. 20, keeping the signal in buy mode. The International Trend Tracking Index, at 7.71% above its trend line, has remained in buy territory since May 7, 2025, according to the weekly StatSheet from Successful Investment.
The TTI acts as a compass for the newsletter's ETF strategy. When the index crosses above and holds above the long-term moving average, it signals a green light to buy domestic and international ETFs. A cross below triggers a sell signal. Positions are managed with a 12% trailing stop loss.