Back to Markets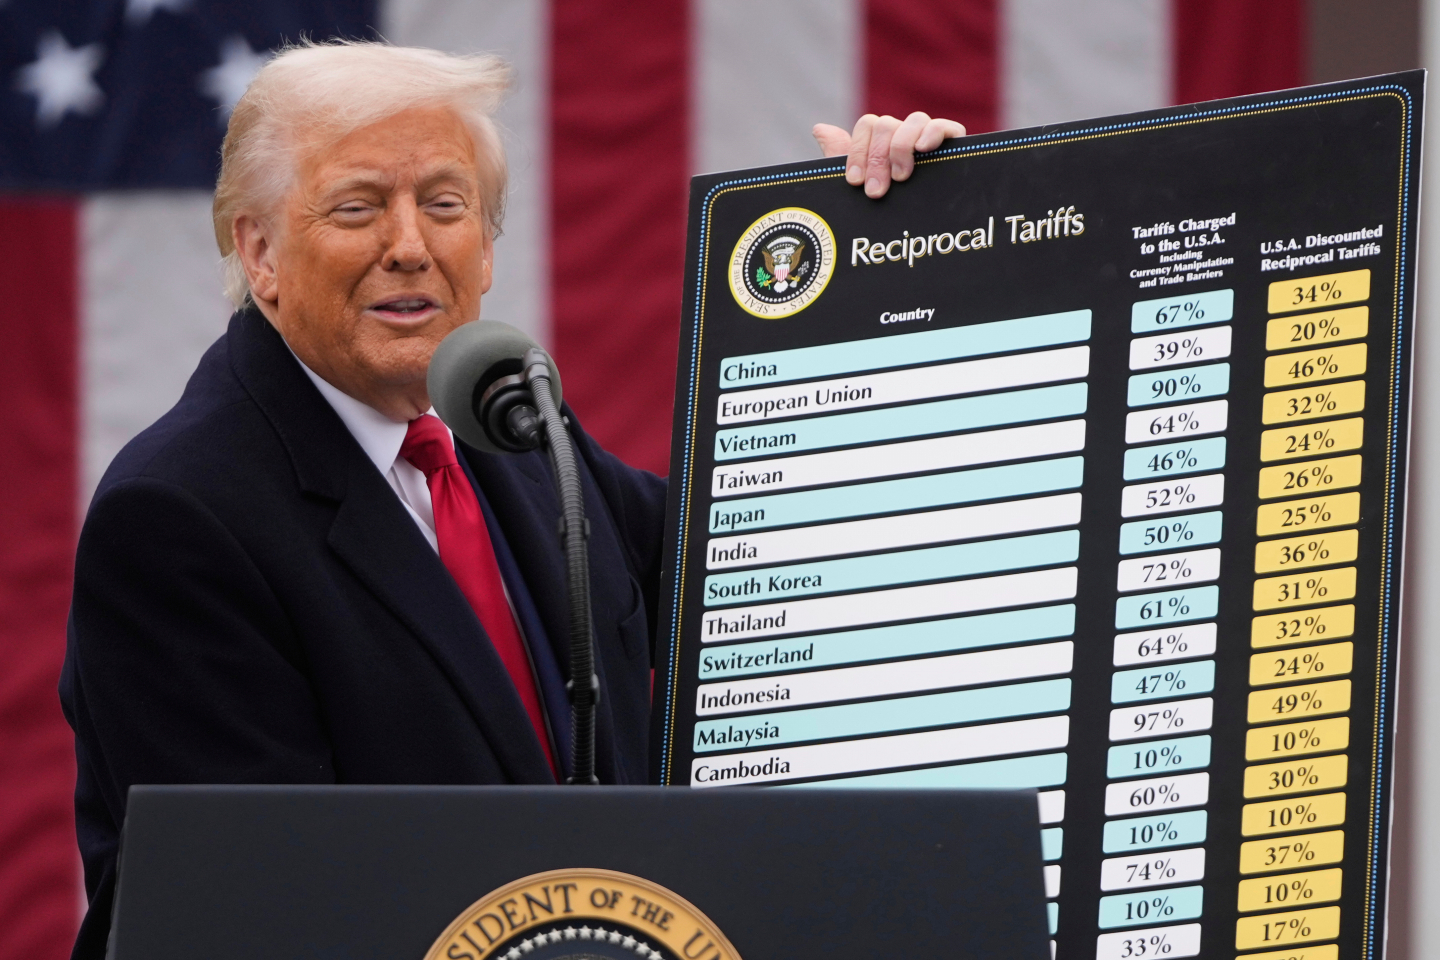
Stocks● Neutral
Trump's Double Shock: Tariffs and War Reshape the Stagflation Bet
Tariffs and the Iran war reversed the golden age narrative. CPI rose 140 bps in three months, gas prices surged 41%, and GDP revisions point to stagflation. Here is the sector read-through and the next catalyst to track.
Continue with
The Risk Event: Two Policy Shocks in One Quarter
On April 2, 2025, President Trump unveiled reciprocal tariffs that imposed import taxes on goods from around the world. Less than two months earlier, on February 28, the war in Iran began. These two events have combined to reverse the economic narrative that Trump promoted in his February 24 State of the Union address, where he declared that “inflation is plummeting, incomes are rising fast. The roaring economy is roaring like never before.” The data since then tells a different story.
The risk event is not a single headline. It is a compounding sequence: a tariff shock followed by an energy supply shock, both originating from the same administration. The market must now price a stagflation scenario that was not on the radar at the start of 2025.
The Mechanism: How Tariffs and War Compound
Tariffs raise the cost of imported goods directly. The reciprocal tariffs announced April 2 were broad-based, affecting goods from around the world. Even though the Supreme Court struck down most of the new tariffs on February 20, 2025 – four days before the State of the Union – the uncertainty and the on-again, off-again nature of U.S. trade policy have already disrupted supply chains. The previously collected tariffs are being refunded, the damage to trade relationships is done.
The Iran war added a second layer. It disrupted world energy markets, and the price of oil rose sharply overnight. The average price of a gallon of gas went from $2.91 in February to $4.10 in April. That is a 41% increase in two months. For a consumer economy, that acts like a tax on disposable income.
The transmission to inflation is straightforward. The all-item Consumer Price Index was growing at an annual rate of 2.4% at the time of the State of the Union. By May, just a few weeks before this writing, it was climbing at 3.8% annually. That is a 140-basis-point acceleration in three months.
Meanwhile, economic growth is slowing. The advanced estimate for fourth quarter 2025 GDP growth, released on February 20, was 1.4% – not “roaring like never before.” That number was later revised down to 0.5%. The first estimate for 2026’s first quarter GDP arrived on April 30 at 2.0%, the second estimate on May 28 revised it down to 1.6%. Real GDP growth in 2024 was 2.4%; 2023 saw 3.4%; 2022 was 1.3%. The trend is decelerating.
The Data That Changed the Narrative
The following table captures the deterioration across key metrics from February to May 2025:
| Metric | February 2025 | May 2025 | Change |
|---|---|---|---|
| CPI (annual) | 2.4% | 3.8% | +140 bps |
| Average gas price | $2.91 | $4.10 | +41% |
| 30-year fixed mortgage rate | 5.76% | 6.3% | +54 bps |
| Average wage growth (YoY) | 3.7% | eroded by inflation | Real wages falling |
| Q4 2025 GDP (advanced) | 1.4% | revised to 0.5% | -90 bps |
| Q1 2026 GDP (first estimate) | 2.0% | revised to 1.6% | -40 bps |
The wage growth number is critical. When Trump spoke in February, average wages were rising 3.7% year-over-year. Two months of flying close to the sun snuffed out the year’s gains. With CPI at 3.8%, real wages are now negative. That is a direct hit to consumer spending power.
Mortgage rates rose from 5.76% on February 26 to 6.3% on May 14. For a first-time homebuyer, that adds hundreds of dollars per month to a typical mortgage payment. Home ownership has become more challenging, especially for first-time buyers.
Affected Assets and Sector Read-Through
Energy: The Obvious Beneficiary with a Tail Risk
Oil producers benefit from higher prices, the mechanism is not clean. The Iran war has driven crude higher, a prolonged conflict risks demand destruction if the global economy slows. The U.S. is a net exporter of oil, so higher prices boost domestic production revenues. The administration’s tariff policy has alienated allies – Italy, Spain, Germany, France, and the UK have not been able to muster support for joining the Iran war effort. That limits the scope of the conflict, it also creates diplomatic friction that could affect energy trade routes.