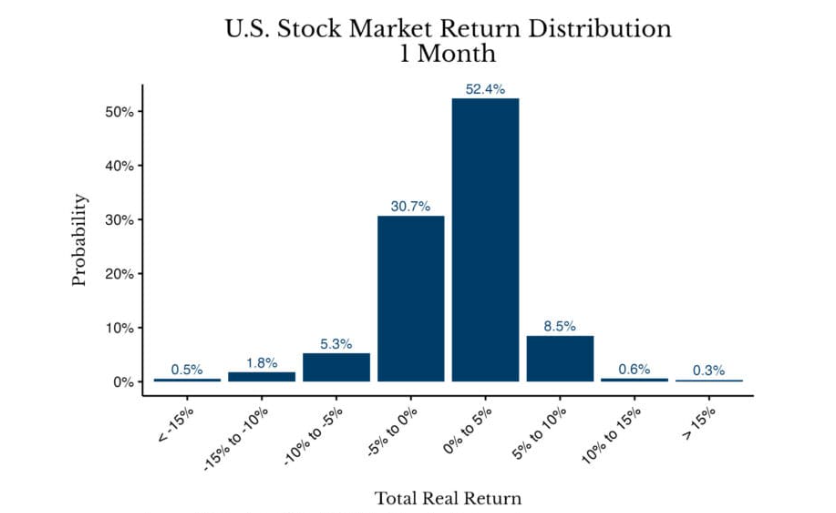
The compound annual return is 10% nominal, 7% real. The reality includes flat decades and five drawdowns. Starting valuation explains 40% of 10-year returns.
A century of US stock returns produces a compound annual figure of roughly 10% in nominal terms, 7% after inflation. Most investors know the headline. The underlying data tells a different story.
The 1930s lost a full decade. The 1970s delivered negative real returns. The 2000s from the dot-com peak through the financial crisis produced a flat nominal result. The smooth log chart hides five separate drawdowns of 30% or more since 1929. The average recovery took three to four years. Some took longer than a decade.
The variation shows up in the 20-year rolling returns. The highest since 1926 was about 14% annualized. The lowest was roughly 1% in real terms. The difference comes down to starting valuation. Buying at a high P/E multiple lowered the subsequent decade's return. Buying at a low one raised it.
Research puts the explanatory power of starting valuation at about 40% of the variance in subsequent 10-year returns. The rest is earnings growth, dividends, and luck. The Shiller CAPE today sits above 30. That level historically preceded below-average returns over the next decade. Past performance is not a guarantee. The mechanism is real.
The 'stocks go up over time' narrative works for a 30-year saver who stays invested through the downturns. For a 5-year horizon the outcome depends heavily on where you start. A retiree drawing down capital during a bear market gets a very different result. The century of data says the trend is your friend. The trend also contains traps. Knowing the cycle matters more than the average.
Prepared with AlphaScala research tooling and grounded in primary market data: live prices, fundamentals, SEC filings, hedge-fund holdings, and insider activity. Each story is checked against AlphaScala publishing rules before release. Educational coverage, not personalized advice.