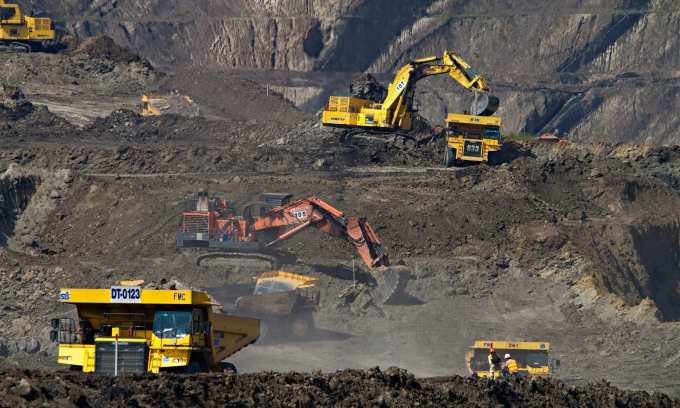
A quiz question on VnExpress asked readers to name the Southeast Asian country that mines nearly one-tenth of the world's coal. The answer, though left unstated in the article, points to a structural concentration in global energy supply that carries direct implications for coal equities, thermal coal prices, and the pace of the energy transition.
The 10% Fact
The VnExpress article, published May 25, 2026, states that one Southeast Asian country's coal output accounts for nearly 10% of the global total. That single statistic, presented as a trivia prompt, masks a deeper market reality: a concentrated supply base that leaves import-dependent economies exposed to policy shifts, weather disruptions, or export restrictions in that country.
Why the Number Matters
A 10% share in a globally traded commodity is not trivial. For context, the world's top three coal producers–China, India, and the United States–together account for roughly 70% of global output. A single Southeast Asian producer holding a 10% slice places it among the top five globally. That concentration means any change in that country's mining regulations, infrastructure spending, or export taxes can move the benchmark price for thermal coal in Asia.
The Unnamed Producer
The VnExpress quiz does not name the country. Based on production data from the International Energy Agency and the U.S. Energy Information Administration, the only Southeast Asian nation with output near that level is Indonesia, which has been the world's largest thermal coal exporter for years. Indonesia's coal production in 2025 was estimated at about 780 million metric tons, roughly 10% of the global total of 8.1 billion tons. The quiz's framing aligns with that figure.
What This Means for Coal Prices
A 10% supply concentration creates a structural risk premium in Asian coal markets. When Indonesia imposed a temporary export ban in January 2022, benchmark Newcastle coal futures surged 30% in two weeks. The episode demonstrated how quickly a single policy move in that country can cascade through global supply chains.
The Mechanism
Indonesia's coal is predominantly used in power generation across China, India, Japan, South Korea, and Southeast Asia. Because Indonesian coal is typically lower calorific value than Australian or Russian grades, it is not easily substituted. A supply disruption from Indonesia forces buyers to bid up higher-grade coals, lifting the entire price curve.
Current Risk Factors
Several factors could amplify the concentration risk in 2026:
- Domestic market obligations (DMO) that require Indonesian miners to sell a portion of output to state utility PLN at capped prices.
- A new government in Indonesia that may revise mining royalty rates or export licensing rules.
- Weather-related disruptions from La Niña, which historically floods Indonesian mine pits and reduces output.
Energy Transition Pressure
The 10% share also highlights a tension in the energy transition narrative. While global coal demand is expected to plateau and then decline under net-zero scenarios, Indonesia's coal production has continued to rise, driven by domestic power demand and export revenue needs. The country's coal-fired capacity is still expanding, with new plants under construction that will lock in demand for years.
Investor Implications
For equity investors, the concentration means that coal-exposed portfolios are effectively making a bet on Indonesian policy stability. Any shift toward stricter environmental enforcement or higher export taxes could compress margins for miners and raise costs for utilities that rely on Indonesian coal.
Practical rule: When one country controls 10% of a commodity's global supply, any policy shift there becomes a portfolio risk.
Stock and Sector Read-Through
Listed Indonesian coal miners such as PT Bumi Resources, PT Adaro Energy, and PT Indo Tambangraya Megah are direct beneficiaries of the concentration. Their earnings are tied to export volumes and benchmark prices. Conversely, Asian utilities with high exposure to Indonesian coal–such as China Resources Power or Korea Electric Power–face margin risk if supply tightens.
What Confirms the Setup
- A sustained rise in Newcastle coal futures above $150 per ton would signal that supply constraints are biting.
- Any announcement from Indonesia's Ministry of Energy and Mineral Resources about revising DMO rules or export permits would be a catalyst.
- A weakening Indonesian rupiah could boost miner margins in local currency terms, amplifying earnings.
What Weakens the Thesis
- A global recession that cuts industrial demand for power would reduce the premium on Indonesian coal.
- Accelerated renewable energy buildout in China and India could structurally lower coal import needs.
- A new major coal mine coming online in Australia or Mozambique would dilute Indonesia's market share.
The Bottom Line for Traders
The VnExpress quiz is a reminder that commodity markets are often driven by a handful of dominant producers. For traders tracking thermal coal, the 10% figure is not trivia–it is a risk parameter. Watch Indonesian policy, monitor Newcastle futures, and treat any export restriction as a buy signal for coal miners and a sell signal for import-dependent utilities.
For broader market context, see our stock market analysis and the AMD stock page for a contrasting example of semiconductor supply concentration. For broker selection, review the best stock brokers list.