Back to Markets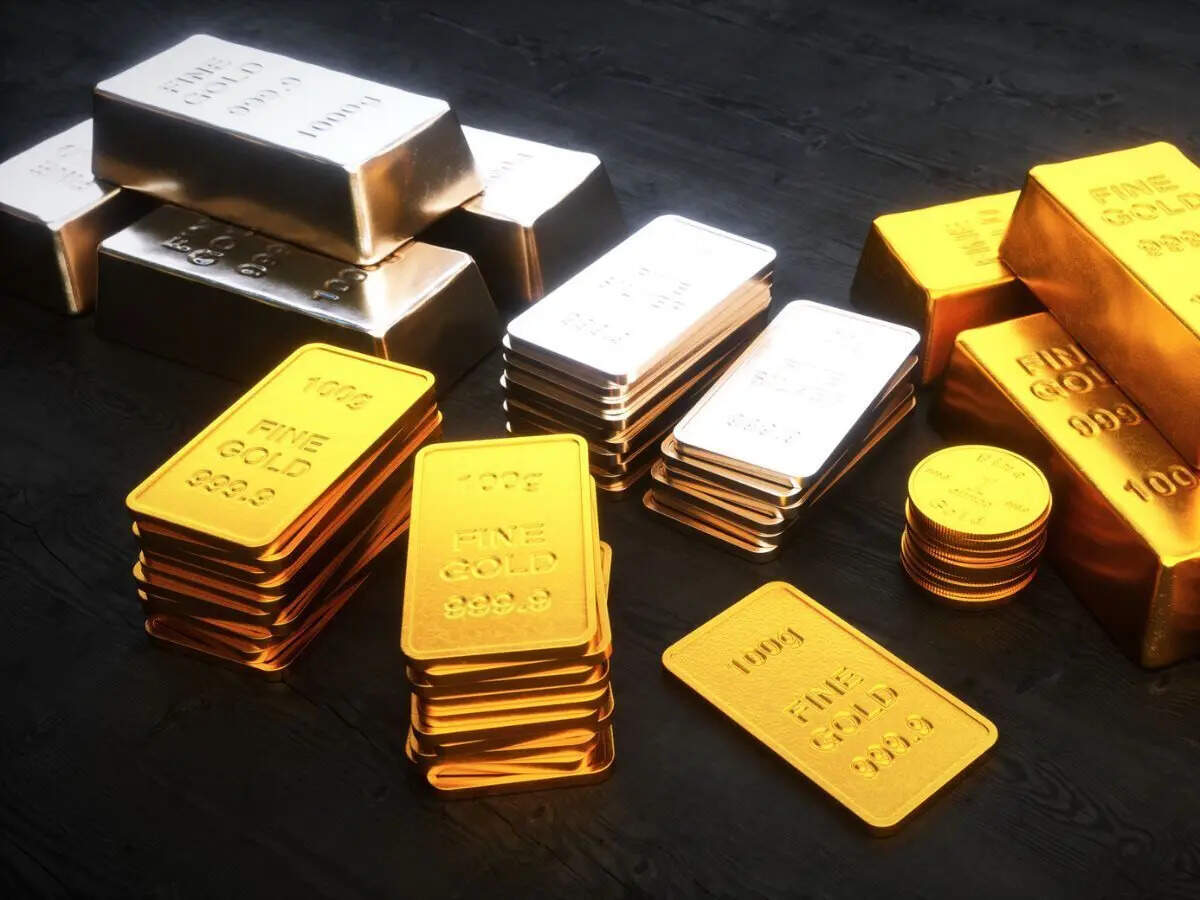
Commodities● Neutral
Precious Metals Outperform Equities in 2026: A Rotation
Precious metals outperform equities in 2026 as safe-haven demand rises. The TrendMap shows a rotation that changes asset allocation priorities.
Continue with
The 2026 edition of the TrendMap performance tracker delivers a clear ranking: precious metals sit at the top, equities lag behind. Gold and silver have outpaced every major equity index so far this year. The divergence is not a one-month anomaly. It reflects a sustained shift in investor preference toward stores of value over earnings-dependent assets.
What the 2026 Performance Tracker Shows
The TrendMap ranks annual returns across equity, debt, precious metals, and real estate segments. In 2026, precious metals occupy the highest position. Equities, while still positive over a 10-year horizon, have posted a weak year. The message is that no single asset class dominates every cycle. Diversification remains the only consistent strategy.
For a broader view of how commodity markets are moving, see our commodities analysis.
Why Precious Metals Are Outperforming Equities
The simple read is that investors are rotating into safe-haven assets. The better read involves two mechanisms. First, persistent inflation concerns have eroded the real return on cash and bonds. Precious metals, which carry no credit risk and hold value in real terms, attract capital when purchasing power is under threat. Second, central banks globally have maintained a net buying stance on gold. That structural demand absorbs supply and supports prices even when speculative interest wanes.
Silver adds an industrial dimension. Its use in solar panels, electronics, and defense components ties its price to both monetary demand and manufacturing activity. When both drivers align, silver tends to amplify gold's move.