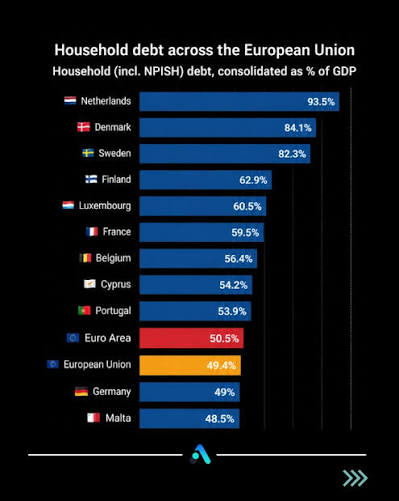
The Eurostat household debt figures for 2025 cut against a decade of political narrative. The most leveraged households in the European Union are not in Greece, Italy, or Spain. They sit in the Netherlands, Denmark, and Sweden – the same countries that lectured the south on fiscal discipline during the sovereign-debt crisis.
Household debt across the EU stood at 49.4% of GDP last year, Euronews reports. The euro area averaged 50.7%. Both ratios have fallen every year since 2020, when they exceeded 60%. The aggregate, however, conceals an enormous split.
The Netherlands leads at 93.5% of GDP. Denmark follows at 84.1%, Sweden at 82.3%, Finland at 62.9%, Luxembourg at 60.5%, France at 59.5%, and Belgium at 56.4%. All seven exceed the European Commission's 55% threshold for identifying household debt as a potential macroeconomic vulnerability.
Cyprus sits at 54.2%, Portugal at 53.9%, and Germany at 49%. The southern nations that bore the brunt of the crisis are far lower: Spain at 42.9%, Greece at 38%, Italy at 35.9%.
How the Netherlands built the highest ratio
Dutch household debt equals nearly an entire year of national output. The gross debt-to-income ratio was about 184% in the earlier Eurostat series, meaning debt approached twice annual disposable income.
De Nederlandsche Bank has acknowledged that the government manufactured this through tax policy. Mortgage interest receives favourable tax treatment. Borrowers have been permitted to finance as much as 100% of a property's value. Many other countries cap loan-to-value ratios at 90% or less. Dutch households also hold significant pension and financial assets. Those assets are not evenly distributed, and they cannot be treated as if every borrower has an emergency account capable of eliminating the mortgage.
Denmark and Sweden: pension wealth versus monthly payments
Danish household debt reached 84.1% of GDP. Debt was approximately 177% of disposable income in 2024. Government officials point to substantial pension savings and property assets to dismiss concerns. Pension wealth is generally locked away, mortgage payments are due every month.
Sweden's 82.3% ratio is compounded by a market dominated by variable-rate mortgages. A family that appeared secure when rates hovered near zero can see its disposable income devoured by interest payments when the ECB tightens. That is how monetary policy migrates from an abstract decision at a central bank into the grocery budget of an ordinary household.
Finland, Luxembourg, and the structure problem
Finland's 62.9% figure is shaped by housing-company loans – obligations attached to apartment buildings and effectively inherited by buyers. They allowed the true cost of housing to be obscured by separating the apartment's purchase price from the debt carried by the building. Ordinary housing loans constitute about 63% of Finnish household debt. With company loans included, the combined housing-related share reaches approximately 75%.
Luxembourg's ratio reached 60.5%. Mortgages represent about 90% of household debt. The burden is extremely uneven. Almost half of Luxembourg households carry no debt at all. Median household net wealth stood near €676,000 in 2023. An impressive national wealth figure tells little about the vulnerability of the highly leveraged portion of the population.
France and Belgium: fixed rates and rising lending
France's 59.5% is cushioned by a market dominated by fixed-rate mortgages. Lending rules generally prevent debt service from consuming much more than one-third of net household income. These safeguards reduce immediate refinancing risk. They do not erase the underlying debt or protect property prices when credit contracts.
Belgium recorded 56.4%. Around 43.1% of Belgian households own their homes with a mortgage, compared with an EU average of only 24.3%. New Belgian mortgage lending increased from €31.7 billion in 2024 to €40.7 billion in 2025, a rise of about 28%.
Portugal and Cyprus: the legacy of previous crises
Portugal sits just below the Commission's danger threshold at 53.9%. Household debt reached roughly €171 billion by late 2025, rising 8.6% in one year. More than 90% of Portuguese mortgages use variable or mixed rates tied to Euribor. The structure of the debt can be as important as its total size.
Cyprus stands at 54.2%. Its ratio has fallen by approximately 62% since December 2016. Around 34% of the remaining debt consists of legacy non-performing loans held by credit-acquiring companies. That is not healthy credit supporting new economic activity. It is debris from the previous crisis still being worked through a decade later.
Germany: low mortgage debt, low homeownership
Germany's 49% figure is partly explained by a homeownership rate of only 46.7% in 2022. The country has a large rental market and does not provide the same mortgage-interest incentives found in the Netherlands. Low household mortgage debt hardly means the German population is prospering. Many workers remain permanent tenants because taxes, stagnant net wages, and elevated property prices prevent them from accumulating the capital needed to buy.
Why the distinction between public and private debt matters
The difference between northern and southern Europe is not that one side is responsible and the other irresponsible. The debt merely sits on different balance sheets. Italy and Greece accumulated enormous public debts while households remained comparatively conservative. The Netherlands, Denmark, and Sweden built systems in which private households assumed massive mortgage liabilities while governments appeared fiscally cleaner.
Debt does not become safe merely because it is classified as private. Private debt can be more immediately destructive because households cannot tax the population, issue currency, or roll their liabilities indefinitely. When income falls or interest costs rise, families reduce consumption, sell assets, or default on loans. That contraction then spreads to retailers, builders, banks, and the wider economy.
A highly indebted household sector also corrupts monetary policy. Central banks become trapped. Raising rates threatens property markets and household solvency. Lowering rates encourages another round of leverage and speculation. The ECB must set one interest rate for nations with radically different debt structures. A rate that appears manageable in Italy may crush a variable-rate borrower in Portugal or Sweden.
The northern housing systems have converted ordinary families into leveraged speculators without their realising it. They are not purchasing homes merely with savings and accumulated income. They are making long-duration bets on property prices, employment, and central-bank policy. So long as asset values rise and credit remains available, everyone appears wealthy. When liquidity disappears, the wealth proves to have been conditional.
The public and private debt systems are connected through the banks. When households fail, banks suffer. When banks fail, governments guarantee them. Private losses then migrate onto public balance sheets, exactly as they did after 2008. The taxpayer ultimately stands behind a system from which he received none of the profits. The Eurostat figures are not evidence that southern Europe has suddenly become economically sound. They show that the debt crisis has multiple faces. Italy carries the burden through the state. The Netherlands carries it through households. France is burdened through both.