The median contract price for new single-family homes in the United States fell to $387,400 in March, marking the lowest level since July 2021. This 6.2% year-over-year decline reflects a broader trend in the housing sector where builders are aggressively discounting to clear inventory. While the headline median price provides a baseline, it obscures the deeper reality of the market because it excludes the heavy use of mortgage-rate buydowns and other buyer incentives. When these costs are factored into the equation, the actual price paid by consumers is significantly lower than the contract figures reported by the Census Bureau.
The Mechanism of Margin Compression
The strategy employed by major homebuilders, most notably Lennar, centers on prioritizing unit-sales volume over per-unit profitability to secure market share. In its Q1 financial statements, Lennar reported an average price per home sold of $374,000, a 24% drop from its peak in Q2 2022. This aggressive pricing strategy has come at a direct cost to the bottom line. Lennar’s gross margin on home sales plummeted to 15.2% in Q1 2026, down from 26.9% in Q1 2022. This shift demonstrates that the current housing recovery is not driven by organic demand at premium prices, but by artificial affordability engineered through corporate margin sacrifice.
Builders are effectively subsidizing the cost of capital for buyers to keep the pipeline moving. Because these incentives are not captured in the median contract price, the official data likely underestimates the extent of the price correction currently rippling through the industry. For investors, this suggests that the sustainability of current sales volume is tethered to the builders' willingness to continue eroding their gross margins. If the cost of these incentives rises or if margins reach a floor, the current support for unit sales could evaporate rapidly.
Inventory Dynamics and Regional Concentration
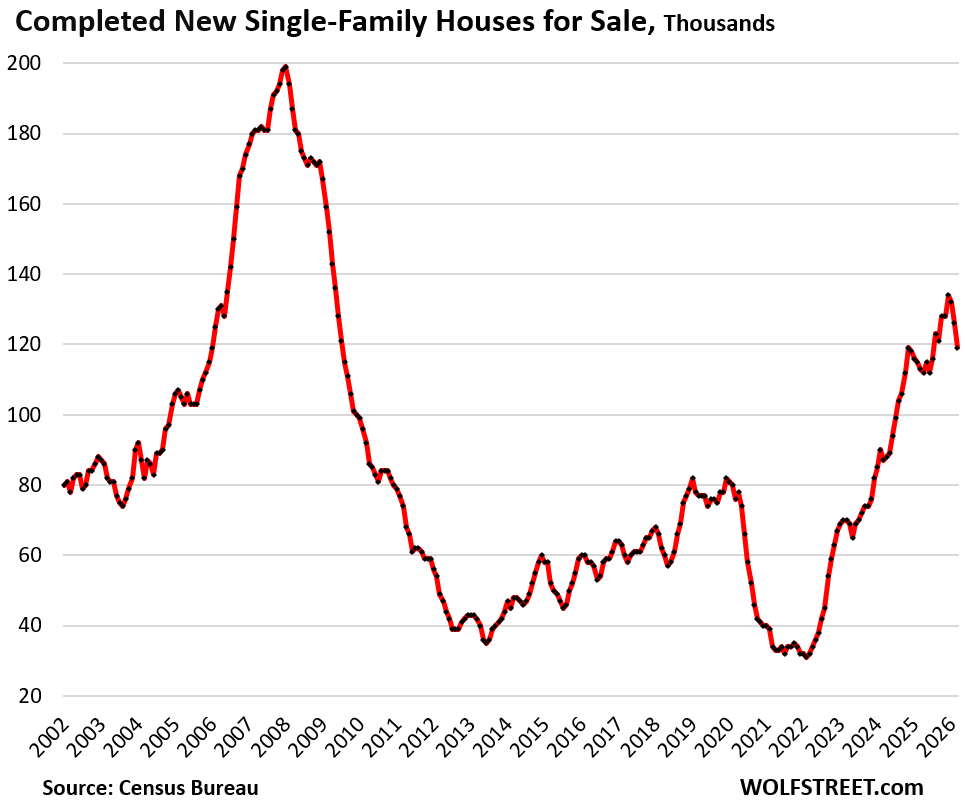
Total inventory of single-family homes at all stages of construction remains elevated at 475,000 units, a figure that is 45% higher than in March 2019. While builders have made minor progress in reducing the number of completed “spec homes” for sale—which dropped to 119,000 in March—the levels remain 54% above 2019 benchmarks. The concentration of this inventory is heavily skewed toward the South and West, which together account for 89% of total sales and 82% of total inventory.
In the South, inventory levels are 60% higher than they were in March 2019, despite a 4.3% year-over-year decline. The West shows a similar pattern, with inventory up 19% compared to 2019 levels. This regional concentration creates a specific risk profile for builders with heavy exposure to these markets. The Midwest and Northeast, while representing a smaller portion of the total market, have seen inventory levels climb by 40% and 7% respectively since 2019, indicating that the supply glut is not merely a Sunbelt phenomenon but a national issue.
Sales Volume vs. Existing Home Stagnation
Despite the inventory overhang, new home sales have shown resilience, ticking up 1.6% year-over-year to 64,000 units in March. This performance stands in stark contrast to the existing home market, which has remained in a deep freeze for four years. The divergence is largely explained by the builders' ability to control the transaction environment. By offering incentives that individual sellers of existing homes cannot match, builders have successfully captured the limited pool of active buyers.
However, the reliance on these incentives creates a fragile equilibrium. The three-month moving average for median prices, which smooths out monthly volatility, reached $403,100 in March—the lowest since September 2021. This downward trend in the three-month average suggests that the price correction is structural rather than transitory. As builders continue to compete for a price-sensitive buyer base, the pressure to maintain or increase incentives will likely persist, further straining margins.
Valuation and Execution Risk
For those evaluating the stock market analysis of the homebuilding sector, the primary risk is the duration of this margin-for-volume trade. If the current inventory levels do not normalize, builders may be forced into a deeper price war to prevent capital from remaining tied up in unsold assets. The fact that the inventory of under-construction homes has remained stagnant for four months indicates that the pipeline is not clearing as quickly as some might hope. Investors should look for signs of margin stabilization in future earnings reports as the primary indicator that the sector has reached a bottom. Until then, the reliance on incentives remains the defining feature of the current housing cycle, much like the market sentiment and the economic bubble of social dynamics that often precedes shifts in asset pricing.