Neural networks and embeddings let insurers distinguish risk at the property level, not the ZIP-code level. Verisk explains how the approach outperforms coarse geographic groupings.
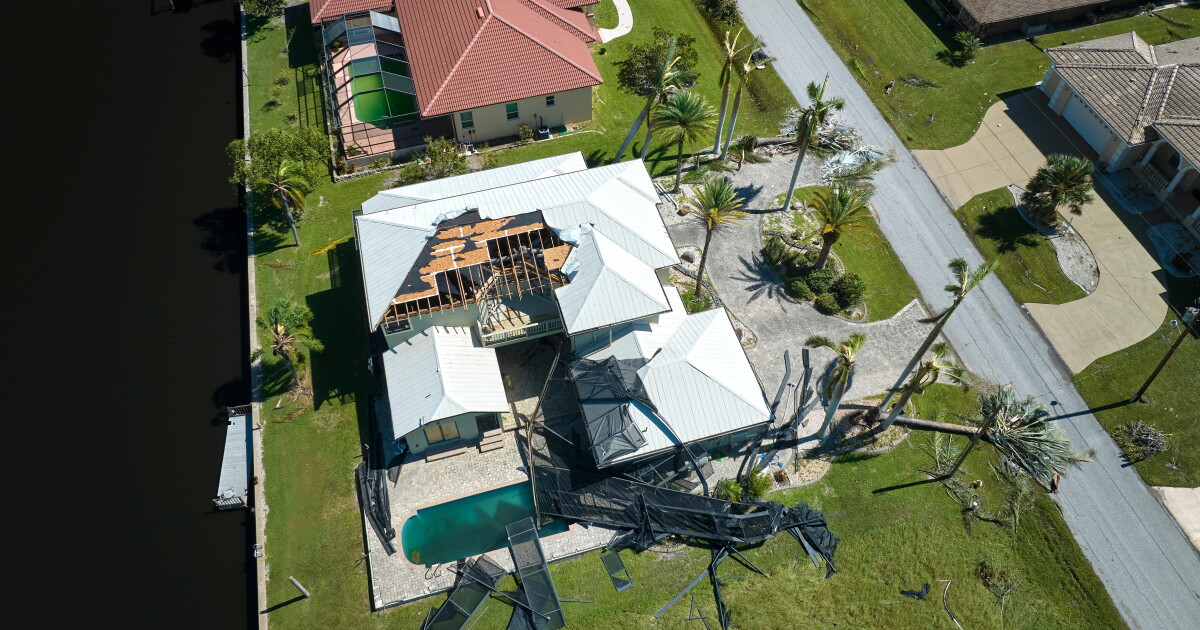
A storm hits two houses on the same street. One takes heavy damage. The other barely needs a roof repair.
Standard insurance models lump them into the same bucket because they share a ZIP code. That assumption – that risk spreads evenly across geography – is the thing neural networks aim to fix.
This is the third piece in a series on how insurance data modeling has evolved. The first covered the shift from manual report reviews to structured attributes and predictive models. The second introduced neural networks and embeddings, which learn patterns directly from data rather than relying on pre-defined human rules. Here the focus is on property risk, where the payoff is largest.
Traditional property models carve the world into coarse zones: ZIP codes, metropolitan statistical areas, census blocks. They tack on static attributes – roof age, construction type – and occasionally sprinkle in weather or claims history. All of that is useful. It also assumes risk is roughly uniform inside those boundaries. Two houses on the same block get the same score.
The problem is that property risk is nonlinear, interdependent and time-sensitive. A house next to a creek, with a different foundation and a newer roof, floods differently than its neighbor. One has a tree that fell five years ago; the other had a fire. Traditional machine learning struggles to connect those dots because the relationships are not linear and do not fit into neat category columns.
Neural networks are designed to handle that mess. During training, they generate embeddings – compact numerical representations that map how properties relate to each other across time and space. Think of an embedding as a coordinate in a multidimensional risk space. Two properties with the same roof age but different claim histories and weather exposures end up in different positions. Two properties with different construction types but similar loss patterns sit closer together. The model finds similarities the ZIP-code approach misses.
Verisk, which published this analysis, says the approach can produce wider separation between high-risk and low-risk properties than traditional methods. More separation means insurers can price more precisely, not just raise rates for everyone in a territory. It also feeds into underwriting decisions, policy lifecycle management and portfolio risk.
The implications go beyond pricing. If a carrier can see that a specific block has ten houses that behave like high-risk properties even though the ZIP code says otherwise, the carrier can adjust exposure. It can buy reinsurance for the properties that need it. It can flag a cluster before the next storm hits.
This is not theoretical. As more data streams in – weather telemetry, satellite imagery, sensor data from smart homes – the embeddings get richer. The model learns. The same network that now pulls apart subtle risk differences in a single ZIP code will eventually do it at the parcel level for entire regions.
Two neighboring houses survive the same storm differently. Insurers cannot control the weather. They can get better at understanding why.
Prepared with AlphaScala editorial tooling from the source reporting linked above. Indexable analysis may include a cited Alpha Score value. Publishing checks screen each story before release. Educational coverage, not personalized advice.