Stocks● Neutral
Gallup: Global Acceptance of Minorities Rises; U.S. Gap Widens
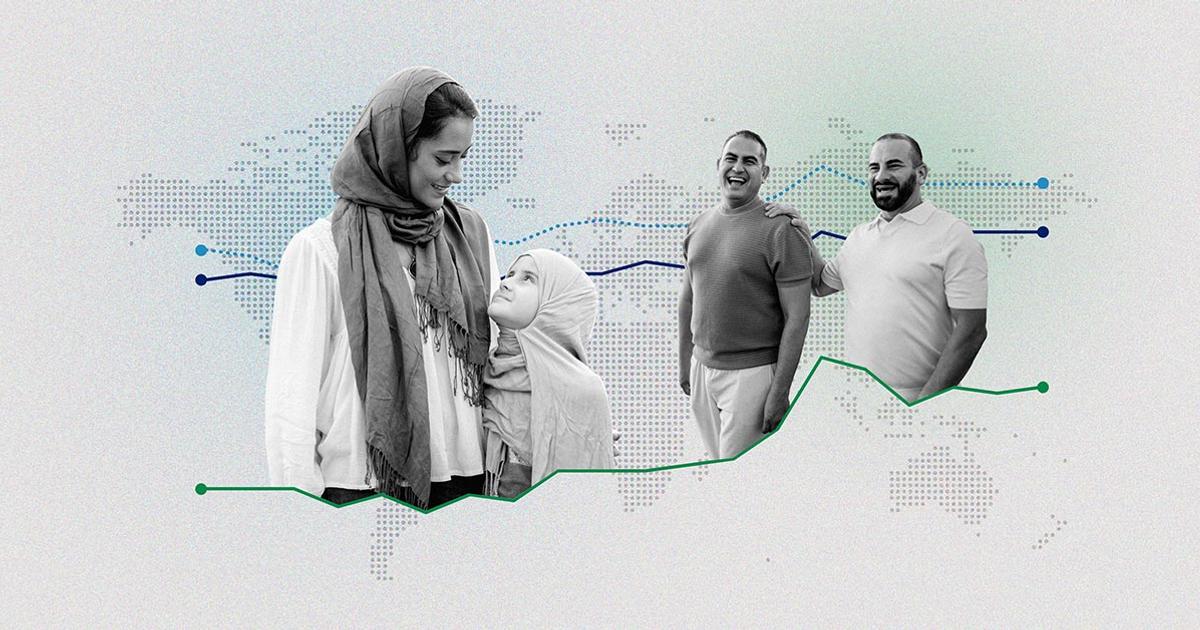
A median of 74% of adults worldwide say their community is good for racial/ethnic minorities. In the U.S., 96% of migrants see acceptance, 81% of native-born agree.
Continue with
More adults worldwide now see their community as a good place for racial and ethnic minorities and immigrants than two decades ago, Gallup said. Acceptance of gay or lesbian people has also improved, doubling from a low of 19% in 2011 to 40% in 2025, the polling firm found.
Across at least 120 countries surveyed in 2025, a median of 74% of adults said their local area is good for racial and ethnic minorities. For immigrants, the figure was 66%. Gay or lesbian acceptance, while higher, still trails those groups by a wide margin.
The world has gradually grown more accepting of racial and ethnic minorities than of immigrants. In 2009, the two were on par at 56%. Since 2021, both indicators have been stable globally. Despite the long-term increases, 20% of adults still say their area is not a good place for ethnic minorities, 28% for immigrants and 44% for gay or lesbian people, Gallup said.
Gallup also tested whether perceptions of community acceptance relate to how people rate their own lives. Among those who said their area is not a good place for any of the three minority groups, 21% rated their lives as "thriving" on Gallup's Life Evaluation Index. That figure rose to 24% among those who saw their area as good for one minority group, 27% for two and 40% for all three.
The same pattern appears in daily experiences. In communities where more people see the local area as good for minorities, more people report positive emotions and fewer report negative emotions, Gallup said. People in more accepting communities are also more likely to be satisfied with their local area, to have people they can count on for help, to feel safe walking alone at night, and to be satisfied with their freedom to choose what they do.
Gallup cautioned that the relationship does not prove causation. People who are happier and more connected may naturally take a more generous view of those around them. Still, the pattern holds across every region of the world, in high-income and low-income countries alike.