Stocks● Neutral
ETFs Hold Buy Signals as Trend Tracking Indexes Stay Above Long-Term Moving Averages
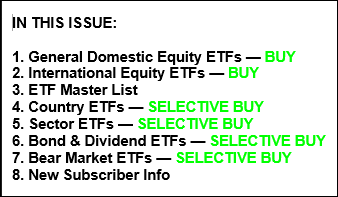
Domestic TTI stays in buy mode at 7% above trend line; International TTI holds at 6.16% since May 2025 buy signal. Weekly ETF tables ranked by M-Index momentum.
Continue with
The Domestic Trend Tracking Index, our primary timing indicator for U.S. equity ETFs, remains in "Buy" mode after closing Thursday at a 7.00% premium above its long-term moving average. The International TTI, which triggered a buy signal on May 7, 2025, sits 6.16% above its trend line.
Both indexes have held above their respective moving averages for weeks, meaning the system's rule-based approach continues to favor long positions across domestic and international high-volume ETFs. All open positions are managed with a 12% trailing stop loss to limit downside risk.
The weekly High Volume Domestic ETF table, ranked by M-Index momentum, is available here: http://www.successful-investment.com/SSTables/HVDomETFs072326.pdf
For international exposure, equivalent ETFs ranked by the same momentum metric are listed here: http://www.successful-investment.com/SSTables/HVInternETFs072326.pdf
The full master list of all tracked ETFs, also sorted by M-Index, can be accessed here: http://www.successful-investment.com/SSTables/HVETFMaster072326.pdf