Stocks● Neutral
Domestic ETFs Stay in Buy Mode as Trend Index Holds 11% Edge
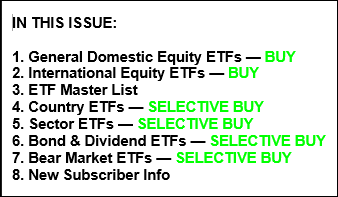
Domestic ETFs hold Buy signals as the Trend Tracking Index sits 11.18% above its moving average. International funds are 9% above trend. Full momentum tables and stop-loss rules inside.
Continue with
Domestic stock ETFs are still in "Buy" mode after the Trend Tracking Index widened its lead over the long-term moving average to +11.18% through Thursday's close. The green line in the chart has held above the red trend line since the crossover, and the newsletter's trailing sell stops remain the only thing standing between current positions and the exit door.
International ETFs show a similar setup, trading +9.00% above their trend line. That signal has been live since May 7, 2025, making it a 15-month run without a red light.
The system itself is simple. Buy when an index crosses above its long-term moving average and stays there. Sell when it falls below and keeps falling. A 12% trailing stop loss protects the equity and international positions. Country and sector funds get a tighter leash at 10%.
What's in the Tables
The weekly master list, updated through Aug. 13, ranks every ETF in the tracked universe by M-Index, the proprietary momentum score that drives the newsletter's rankings. Momentum figures are not adjusted for dividends, so income payouts will not flatter a fund's position in the sort.
High-volume domestic equity ETFs get their own table, as do international funds. Country-specific funds are listed separately, and the newsletter flags them as the wildest category in the lineup. Sector ETFs round out the growth side, with the same 10% trailing stop recommendation.