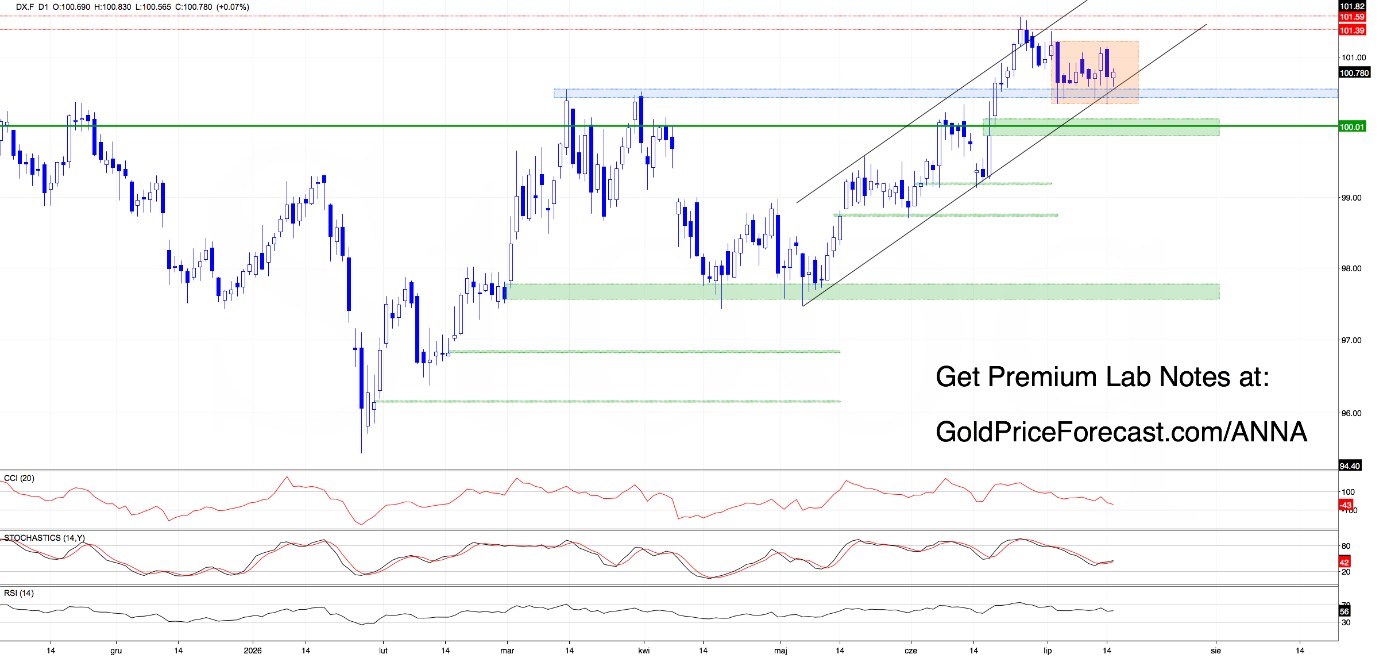
The dollar index, palladium, and copper each sit at a technical inflection point on the weekly charts, according to Anna Radomska, a market analyst at Golden Meadow and GoldPriceForecast.com. In her latest Lab Note, Radomska said the daily consolidation in the dollar remains intact. On the weekly chart, the bigger picture carries more weight for the next directional move.
The dollar is defending a key support zone. Sellers have printed a bearish engulfing pattern, reinforcing overhead resistance. Radomska identified a black support/resistance line based on prior swing highs and the 38.2% Fibonacci retracement as the critical battleground. If buyers regain control, the next upside target sits near the 50% Fibonacci retracement around 102.50. Should sellers prevail, the minimum downside projection from the consolidation's height points to roughly 99.23, a level that could also test the bullish engulfing formation from June.
A break above 102.50 would open the door to the 50% Fib level, a zone that has acted as resistance since late 2023, Radomska noted. Traders watching the dollar will also monitor the impact on gold and other commodities, which often move inversely to the greenback. A move below 99.23, by contrast, would put the June 2024 lows in play and could accelerate dollar selling across asset classes.
Palladium and Copper
Palladium has already delivered the move Radomska anticipated. After defending support around 1,248, the metal closed Monday's bearish gap and rallied toward the 1,324-1,363 target zone. That range now coincides with the upper boundary of a green rising channel, forming a strong resistance area. Radomska said she would be more confident in the bullish case if buyers can secure a weekly close above 1,296.50. Momentum indicators continue to generate buy signals. The rising channel boundary suggests caution at current levels.
A weekly close above 1,296.50 would confirm the breakout and target the next resistance cluster near 1,363, Radomska said. That level lines up with the 50% retracement of the 2022-2023 decline. If palladium fails to hold above 1,248, the multi-week consolidation could resume, with support at 1,200.
Copper has reclaimed the upper boundary of the red declining channel, opening a path toward this year's highs. The next major obstacle is a large bearish gap between 637.25 and 649.35, particularly around 650, where several technical factors overlap. On the four-hour chart, the measured move of an ABCD pattern completes in the same area, while RSI indicators are heavily overbought and showing bearish divergence, a sign buyers may need a pause before the next leg higher.
The weekly copper chart is more encouraging, Radomska noted. Copper now trades above the upper boundary of the green rising channel and above the orange consolidation zone, improving the longer-term technical picture. A weekly close above 640.35 would strengthen the bullish case, opening the door toward the 161.8% Fibonacci extension at 675.43 and potentially the 692-700 zone.
A close above 650 would be a significant breakout, Radomska said, as it would fill the bearish gap and trigger the ABCD measured move. The 692-700 zone represents the next major resistance from the 2022 highs. If copper fails to hold above 640, the red declining channel line could be retested, with support at 620.
"The weekly close above 640.35 would open the door toward 675.43," Radomska wrote. That level, along with the 692-700 zone, will be the focus for traders tracking the industrial metal's recovery from its 2023 lows.