Back to Markets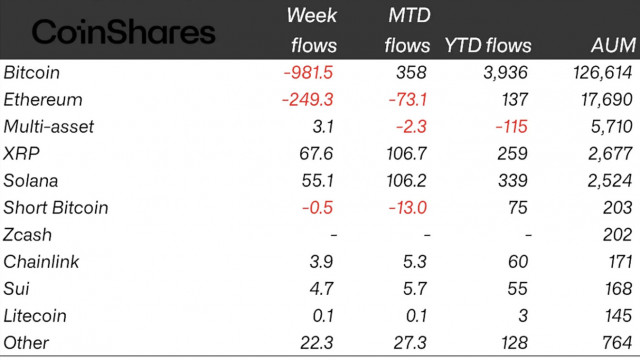
Crypto▼ Bearish
Crypto Funds End 7-Week Inflow Streak With $1.07B Outflow
Gauge positioning shifts after $1.07B outflow ends crypto fund 7-week inflow streak. The next CoinShares print sets the confirmation point.
Continue with
Crypto fund flows turned negative for the first time in seven weeks. CoinShares data covering the week ending May 16 recorded $1.07 billion in net outflows from digital asset investment products. This is the third-largest single-week withdrawal of 2026, exceeded only by two weeks in late January. The data resets a flow narrative that had been uniformly bullish for almost two months.
The $1.07B Outflow and the End of the Seven Week Streak
The reversal matters for its scale and its timing. A seven-week inflow run built a cumulative long position across the largest crypto ETPs. When that pipeline reverses at a $1B clip, the unwind loads direct selling pressure into the underlying spot markets. The simple read is that momentum capital rotated out of the category. The better read focuses on the compositional shift of the remaining holder base. Investors who bought through the inflow streak now hold a larger percentage of the float at higher average entry prices. That change in ownership structure stiffens overhead resistance and removes a layer of support near current spot levels, making the market more sensitive to further negative flow data.
The January outflow weeks coincided with a broad macro risk-off move triggered by trade policy headlines. The week ending May 16 lacks an equivalent external trigger. This absence makes the flow data more significant for the internal market narrative. Allocators reducing exposure without a simultaneous equity rout suggests the crypto risk premium is being actively repriced rather than passively dragged lower. That type of repricing typically extends across multiple weeks and is harder to reverse with a single price catalyst.