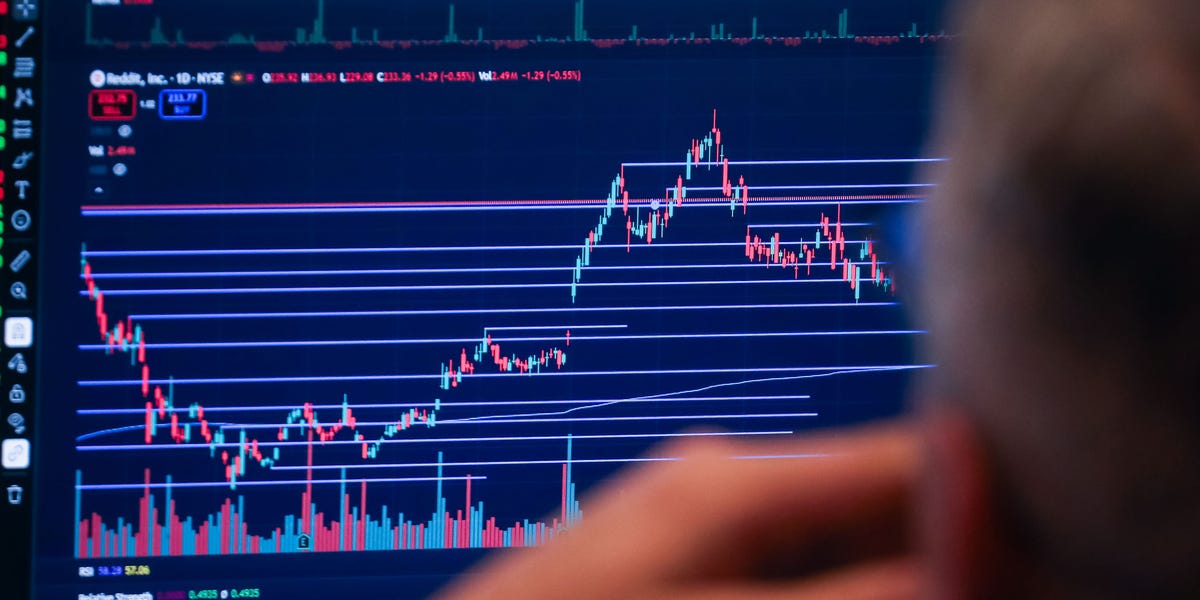
The S&P 500 slipped below its 50-day moving average last week. Dip-buyers pushed it back within 1% of that line. Chip-sector damage has been deeper. The iShares Semiconductor ETF is down 18% from its late June peak. At its lowest level in eight weeks, the VanEck Semiconductor ETF sits 18% below its own 50-day moving average. A team of Piper Sandler analysts led by Craig Johnson said the fund could test its 200-day moving average, a breach that would imply another 20% decline.
"The Semi/AI trade is facing a reality check as recent technical damage opens the door to a deeper correction toward their 200-day MAs," the firm wrote in a client note Monday. "While short-term tactical bounce is likely, the intermediate-term trends have been violated."
Adam Kobeissi, author of The Kobeissi Letter, said the S&P 500's dip below 7,530 was quickly reversed. Dip-buyers pushed the index back above 7,500. The long-term uptrend remains intact, he said. Above 50, the Relative Strength Index bounced. The Bollinger Bands, at 7,345 and 7,615, suggest the broader uptrend remains in place, according to Kobeissi.
"This week, we look for a recovery back toward 7,600 as earnings season gains momentum and risk appetite stands strong," Kobeissi wrote. "We remain bullish of the S&P 500 with a 7,700 target and 7,200 stop-loss."
Mark Newton, head of technical strategy at Fundstrat, said the S&P 500 and Dow Jones Industrial Average remain in technical ranges that support a longer-term move higher. The Dow Jones Transportation Average recently closed near its all-time high.
"It's difficult to view this past week as anything more than a rotation," Newton wrote. He flagged 7,421 as a "make-or-break" level for the S&P 500. A close above that, he said, would suggest a bullish environment.
Bespoke Investment Group flagged a pattern in the Nasdaq 100 that has preceded weak returns. Over the last 50 days, the index has seen more than 20 sessions where it swung at least 1% in either direction. Its highest level is less than 10% from its lowest.
Since 1971, the index has posted a negative median return over the next six months after such a pattern, Paul Hickey, cofounder of Bespoke, wrote in a client note. "Based on the results, it doesn't portend an especially attractive short-term picture for the market," Hickey said.