The S&P 500 and Dow Jones Industrial Average both hit new record highs this week. The Nasdaq Composite surged nearly 4% in the last five days after months of volatility. None of that has quieted the valuation debate.
Warren Buffett’s preferred market gauge – the ratio of total U.S. stock market value to GDP – now sits at a record 232%. That is the highest reading in history, above the 200% threshold Buffett called "playing with fire" in a 2001 Fortune essay. The ratio stood at roughly 200% in 1999 and early 2000, just before the dot-com crash.
The S&P 500’s Shiller CAPE ratio, which tracks 10-year inflation-adjusted earnings, is at 41. That is the second-highest level on record, behind the 44 reading from late 1999.
Tech companies are spending heavily on data centers. AI-related capital expenditure is expected to top $5 trillion by 2030, according to McKinsey & Company. Some investors see parallels to the dot-com era, when hundreds of internet companies saw their stocks surge before crashing.
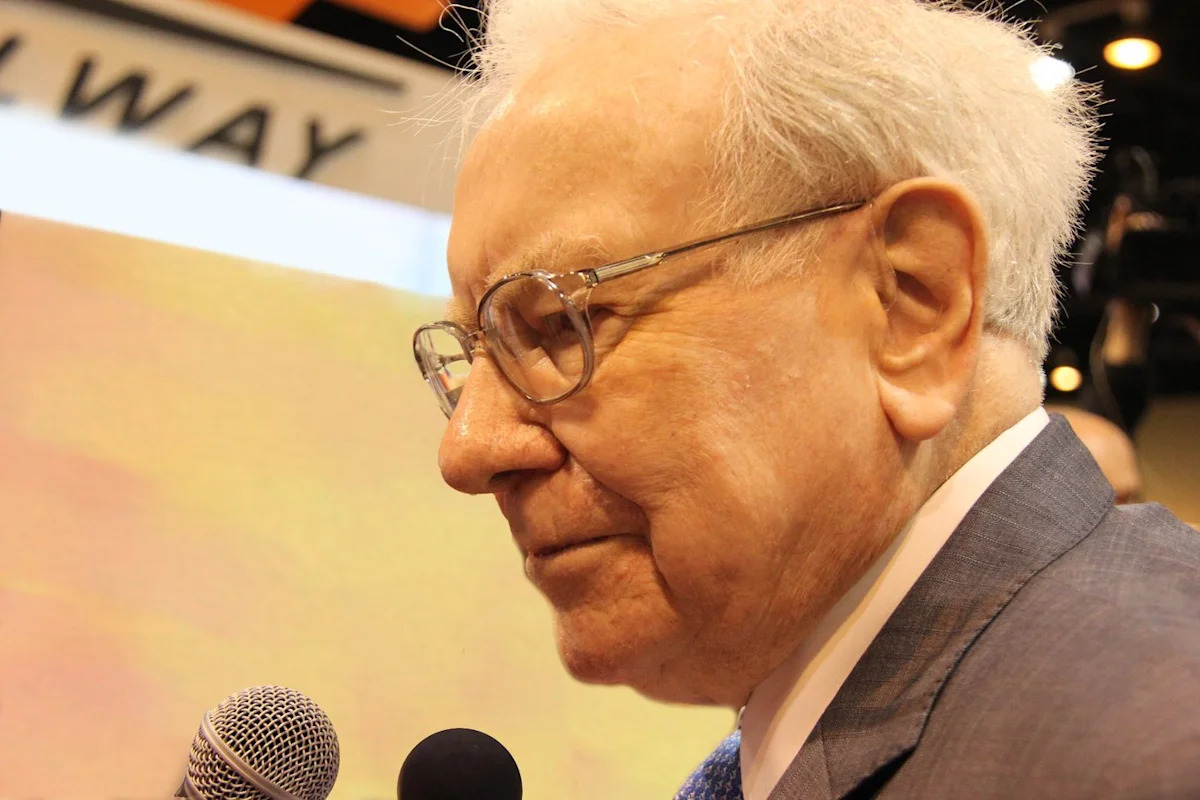
Buffett warned in a 1999 speech that stock prices were due for a pullback. In a recent CNBC interview, he said many investors are getting too comfortable with short-term risky bets. "That's not investing, it's not speculating, it's gambling," Buffett told CNBC. He added that "prices for an awful lot of things will look very silly."
Buffett did not tell investors to avoid stocks entirely. He said the key is finding companies with durable competitive advantages. "The key to investing is not assessing how much an industry is going to affect society, or how much it will grow, but rather determining the competitive advantage of any given company and, above all, the durability of that advantage," he said in his 1999 warning.
BRK.B stock page carries an Alpha Score of 53, labeled Mixed, in the Financials sector. NVDA stock page scores 78, labeled Strong, and trades at $223.96, up 2.27% today.
No single market metric predicts short-term moves. The Shiller CAPE and the Buffett indicator both reached extreme levels before the 2000 crash, but they also stayed elevated for extended periods before the downturn. The question is not whether the market looks expensive. It is which companies have the fundamentals to survive if sentiment turns.