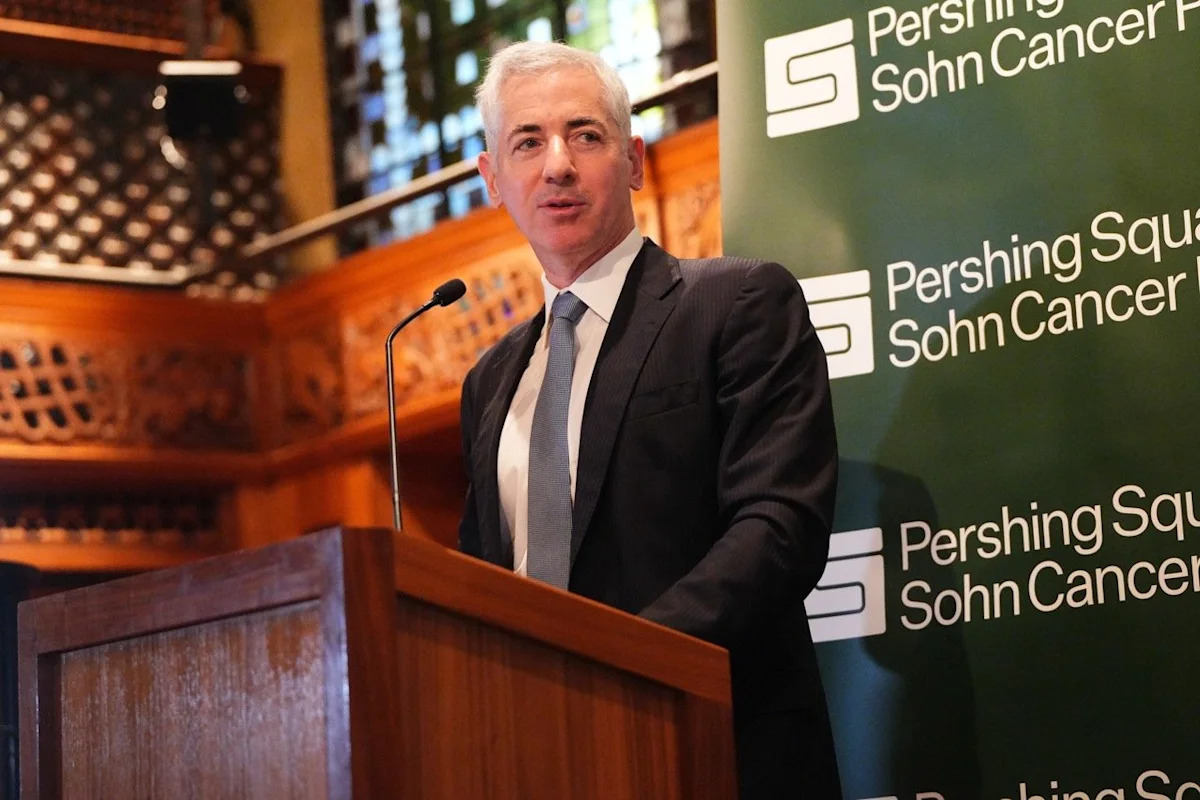
Pershing Square, the investment firm run by billionaire Bill Ackman, disclosed $1.1 billion stakes in S&P Global (NYSE: SPGI), Visa (NYSE: V), and Mastercard (NYSE: MA) in its second-quarter 13F filing. The revelation landed as the three stocks trade at sharply different distances from their highs.
S&P Global closed Friday at $418.80, about 28% below its 52-week high of $579.05. Visa and Mastercard ended the same session 3% and 5% below their own highs, respectively.
The gap is partly mechanical. On July 1, S&P Global spun off its Mobility division, the auto-data business that owns CARFAX. Shareholders received one share of Mobility Global for each S&P Global share they held. Those shares now trade around $20. An investor who held through the separation is down closer to 24% from the high, not 28%.
The rest is a rerating. The market is paying less for each dollar of S&P Global earnings, and the cause traces to the company's growth mix.
Second-quarter revenue, excluding the now-separate Mobility unit, rose 11% year over year to $3.7 billion. The headline businesses delivered. Ratings revenue climbed 17% to $1.3 billion, accelerating from about 13% growth in the first quarter. Indices, the division behind benchmarks like the S&P 500, grew 20% to $534 million.
"We delivered another strong quarter, with record results in two of our benchmark businesses," CEO Martina Cheung said in the earnings release.
The other half of the company is moving far slower. Market Intelligence, a division nearly as large as Ratings by revenue, grew 6% in the quarter. The Energy division grew just 2%.
Adjusted earnings per share still rose 23% to $4.83, helped by margin expansion and share buybacks. The company has repurchased $1.5 billion of stock this year and expects to top $7 billion for 2026.
Visa's fiscal third quarter, ended June 30, showed why the market rarely lets the stock get cheap. Net revenue rose 14% year over year to $11.6 billion. Payments volume grew 10% in constant dollars, processed transactions climbed 10% to 71.7 billion. Adjusted EPS rose 11% to $3.32, and GAAP net income came to $5.6 billion.
Mastercard's second quarter looked similar. Net revenue rose 14% year over year (12% in constant currency) to $9.3 billion. Cross-border volume grew 12%. Value-added services revenue, which includes security, analytics, and consulting, climbed 20%.
Both card networks run on the same engine. Steady consumer spending with faster-growing services layered on top. The market can model their next quarter with unusual confidence and pays for that stability.
That confidence is what separated the charts. Visa and Mastercard deliver roughly 14% growth quarter after quarter from a single dependable source. S&P Global's biggest business, Ratings, depends on how much debt companies choose to issue, an activity that can swing sharply from year to year. The index business tied to the S&P 500 is steadier, though far smaller. About half of the company's revenue is growing 6% or slower right now.
Valuations reflect the difference. Visa and Mastercard trade at about 31 times their earnings over the past year. S&P Global trades at about 25 times, and roughly 24 times the midpoint of its 2026 adjusted earnings guidance.
The networks earn their premium. Their growth is steadier, and steadier growth may always cost more. S&P Global's chart overstates what went wrong. Part of the decline left with the spin-off, and the company just posted records in its two most important divisions while growing adjusted earnings per share 23%. The discount looks deserved. The size of it, arguably, no longer does.
AlphaScala's proprietary data gives S&P Global an Alpha Score of 42 out of 100, labeled Mixed, reflecting the mixed growth profile across its businesses. Mastercard scores 63, labeled Moderate. Visa is not listed in the database, though the two networks share similar characteristics. The S&P Global stock page and stock market analysis offer further context on the valuation dispersion among financial sector stocks.