The S&P 500 pushed into new territory today, closing at 7023 after a session that saw the index open with a gap up from 6968 to 6977. While the index briefly tested a low of 6967, consistent buying pressure propelled the benchmark to an intraday high of 7026, confirming a fresh all-time high.
Market Mechanics of the 7000 Break
This move represents a psychological and technical threshold for the broader stock market analysis community. The gap-up at the open provided the necessary momentum to clear the previous overhead resistance, and the failure to fill that gap suggests that institutional demand remains aggressive at these levels. Traders often look for consolidation after such a significant breakout, but the persistence of the rally throughout the afternoon session indicates that short-sellers were forced to cover into the strength.
Technical Sentiment and Positioning
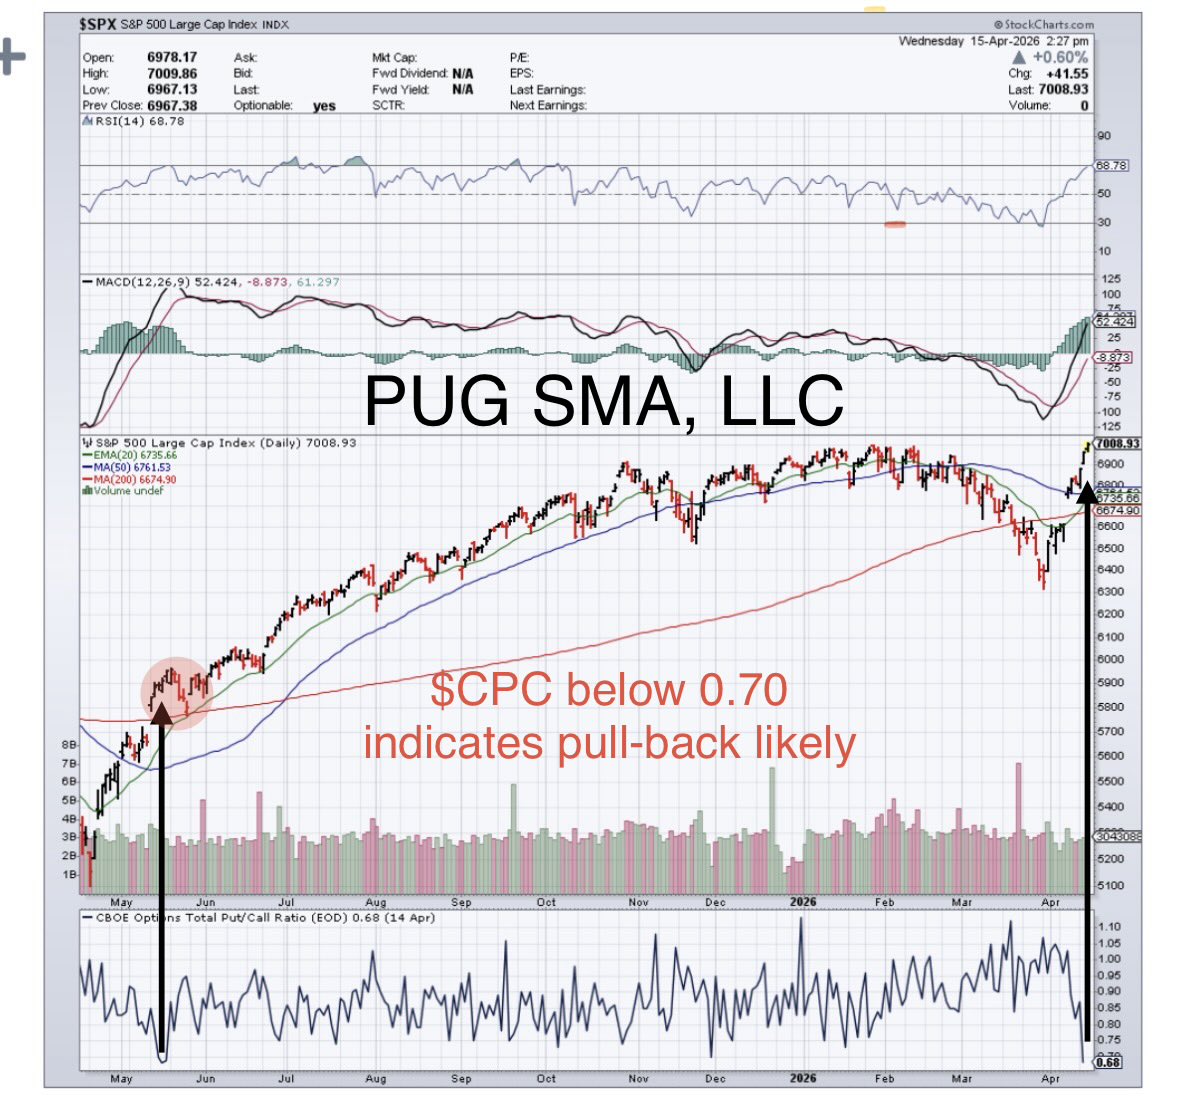
Market participants are currently monitoring the CBOE Total Put/Call Ratio ($CPC), which showed a decline during the session. A falling put/call ratio is traditionally viewed as a signal of rising investor complacency or increased bullish sentiment. When the ratio trends lower, it often suggests that the market is leaning heavily into long positions, which can leave the index vulnerable to rapid deleveraging if volatility spikes unexpectedly.
| Metric | Value |
|---|
| Open | 6977 |
| Intraday Low | 6967 |
| Intraday High | 7026 |
| Close | 7023 |
Implications for Index Traders
- Volatility Compression: With the index now trading above 7000, we expect to see a shift in the options chain as market makers adjust their gamma exposure. Keep an eye on VIX levels; if the volatility index fails to drop alongside the S&P 500's rise, it may signal underlying hedging activity that could cap further upside.
- Sector Rotation: As the S&P 500 hits these levels, look for capital to flow out of high-beta tech names—often tracked via NVIDIA (NVDA)—and into lagging defensive sectors to balance portfolio risk.
- Support Levels: The 6967 intraday low now acts as the primary support level. A retest of this level without a breakdown would be the primary setup for bulls looking to add to positions at a discount relative to the new highs.
Catalysts to Watch
Traders should continue to watch the $CPC for any sudden spikes, as a reversal in that trend often precedes a liquidity-driven pullback. Additionally, monitor the relationship between the S&P 500 and the Nasdaq-100, as divergence between the two often serves as a leading indicator for momentum exhaustion. The market is now in price discovery mode, making the next 48 hours of volume confirmation essential for determining if this breakout holds or fades.
Breaking 7000 is a signal of momentum, but the sustainability of this rally depends on whether the move is supported by a broadening of participation across the index components.