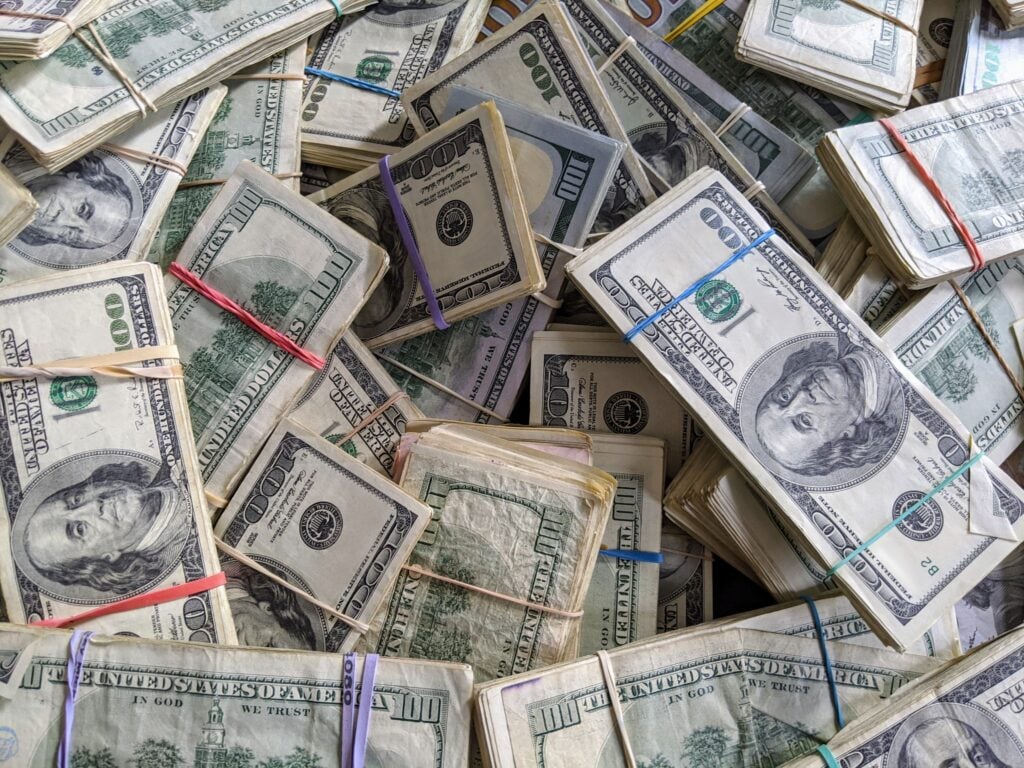
April saving rate fell to 2.6% as spending rose 0.5% and income fell. Core PCE at 3.3% delays rate cuts. Dollar carry, bond yields, and gold repricing.
The U.S. personal saving rate dropped to 2.6% in April, the lowest reading since 2022, while the Fed’s preferred inflation gauge rose to 3.8% year-over-year. The Bureau of Economic Analysis report showed consumer spending increasing 0.5% even as disposable personal income fell 0.1%. For markets, the combination signals a consumer running on depleted buffers and a Fed with less room to cut. This market analysis traces the transmission from the savings rate collapse through bond yields, the dollar, gold, and equity risk premia.
Personal savings totaled $611.7 billion in April. The rate fell to 2.6% from higher levels earlier in the year. The pre-pandemic decade averaged about 7.5%. The drop is not a confidence signal; it is a mechanical result of income declining while spending rose.
Disposable personal income declined by $19.9 billion (0.1%). Consumer spending rose by $111.1 billion (0.5%). The gap of roughly $130 billion was financed by drawing down savings. That arithmetic leaves little cushion for future spending growth unless income accelerates or households take on more debt.
The BEA report described the economy as “K-shaped.” Higher-income households benefit from rising asset values. Lower-income households face mounting cost pressures on essentials. The same spending headline hides two diverging realities. Luxury goods retailers and discount grocers will likely see different earnings trajectories.
The core Personal Consumption Expenditures price index rose 3.3% year-over-year. The headline PCE price index printed 3.8%, the highest since May 2023. Services spending increased $67.2 billion in April, compared with $44 billion for goods. Services inflation – housing, medical care, insurance – is typically stickier than goods inflation. The Fed has repeatedly cited services ex-housing as its key persistence gauge.
Gasoline prices averaged above $4.39 per gallon nationally this week, according to AAA. Housing and food costs also continue to add pressure. These are not transitory inputs; they feed directly into household budgets and into the Fed’s core services measure.
Credit card delinquencies climbed to their highest level since 2010. Student loan and auto loan delinquencies also increased. The New York Fed found that more lower-income families are struggling with food affordability, relying on assistance programs and dipping into savings.
Retirement providers report a rise in hardship withdrawals from 401(k) plans. Workers are tapping long-term savings to cover medical expenses, debt payments, and other emergencies. That data aligns with the saving rate decline: households are liquidating accumulated buffers rather than building them.
Core PCE above 3% pushes the probability of a 2025 rate cut lower. The 2-year U.S. Treasury yield should reprice to reflect a “higher for longer” Fed stance. The 10-year yield reaction depends on the inflation versus growth mix. A sustained core PCE above 3% shifts the balance toward higher term premiums.
A Fed on hold while the European Central Bank and Bank of Japan are cutting or signaling cuts widens the rate differential in the dollar’s favor. The DXY has support from this differential. A stronger dollar is a headwind for emerging-market currencies and for commodities priced in dollars.
Gold tends to weaken when real yields rise because the opportunity cost of holding non-yielding bullion increases. The April inflation print keeps real yields elevated. For gold traders, the key setup is the absence of a Fed pivot. The gold profile details the conditions needed for a rally: gold needs a clear dovish signal from the Fed, and this data delays that signal.
The immediate reading in equity futures was negative. Growth stocks with long-duration cash flows – tech, biotech, unprofitable software – are most exposed to higher yields. The SPX faces a tug-of-war between the “sticky inflation” camp and the “soft landing” camp. The Mixed SPX Futures article shows this tension is already visible in the futures curve.
If the May CPI (scheduled for mid-June) prints at or below the prior month’s level, the rate-cut narrative revives, supporting duration-sensitive sectors. If May CPI matches or exceeds April’s core PCE of 3.3%, the selloff in long-duration names accelerates. The Fed’s June meeting and the updated dot plot are the next major policy markers. Until then, the savings rate and PCE data from April provide the framework: the consumer is slowing and inflation is sticky enough to keep the Fed on hold.
The April data shows a consumer spending from depleted buffers. The next leg of spending depends entirely on real income growth, which was flat. Bond markets will stay under pressure. Dollar carry favors the long side. Gold needs a catalyst that is not present. The May CPI print will determine whether the rate-cut narrative is dead or merely delayed.
Prepared with AlphaScala research tooling and grounded in primary market data: live prices, fundamentals, SEC filings, hedge-fund holdings, and insider activity. Each story is checked against AlphaScala publishing rules before release. Educational coverage, not personalized advice.