The S&P 500 fell about 1.5% this week, the Nasdaq roughly 2.5%. The post-earnings rally in mega-cap names gave back much of its ground. This week brings Nvidia's results, and the overlap between the technicals and the options positioning is unusually tight.
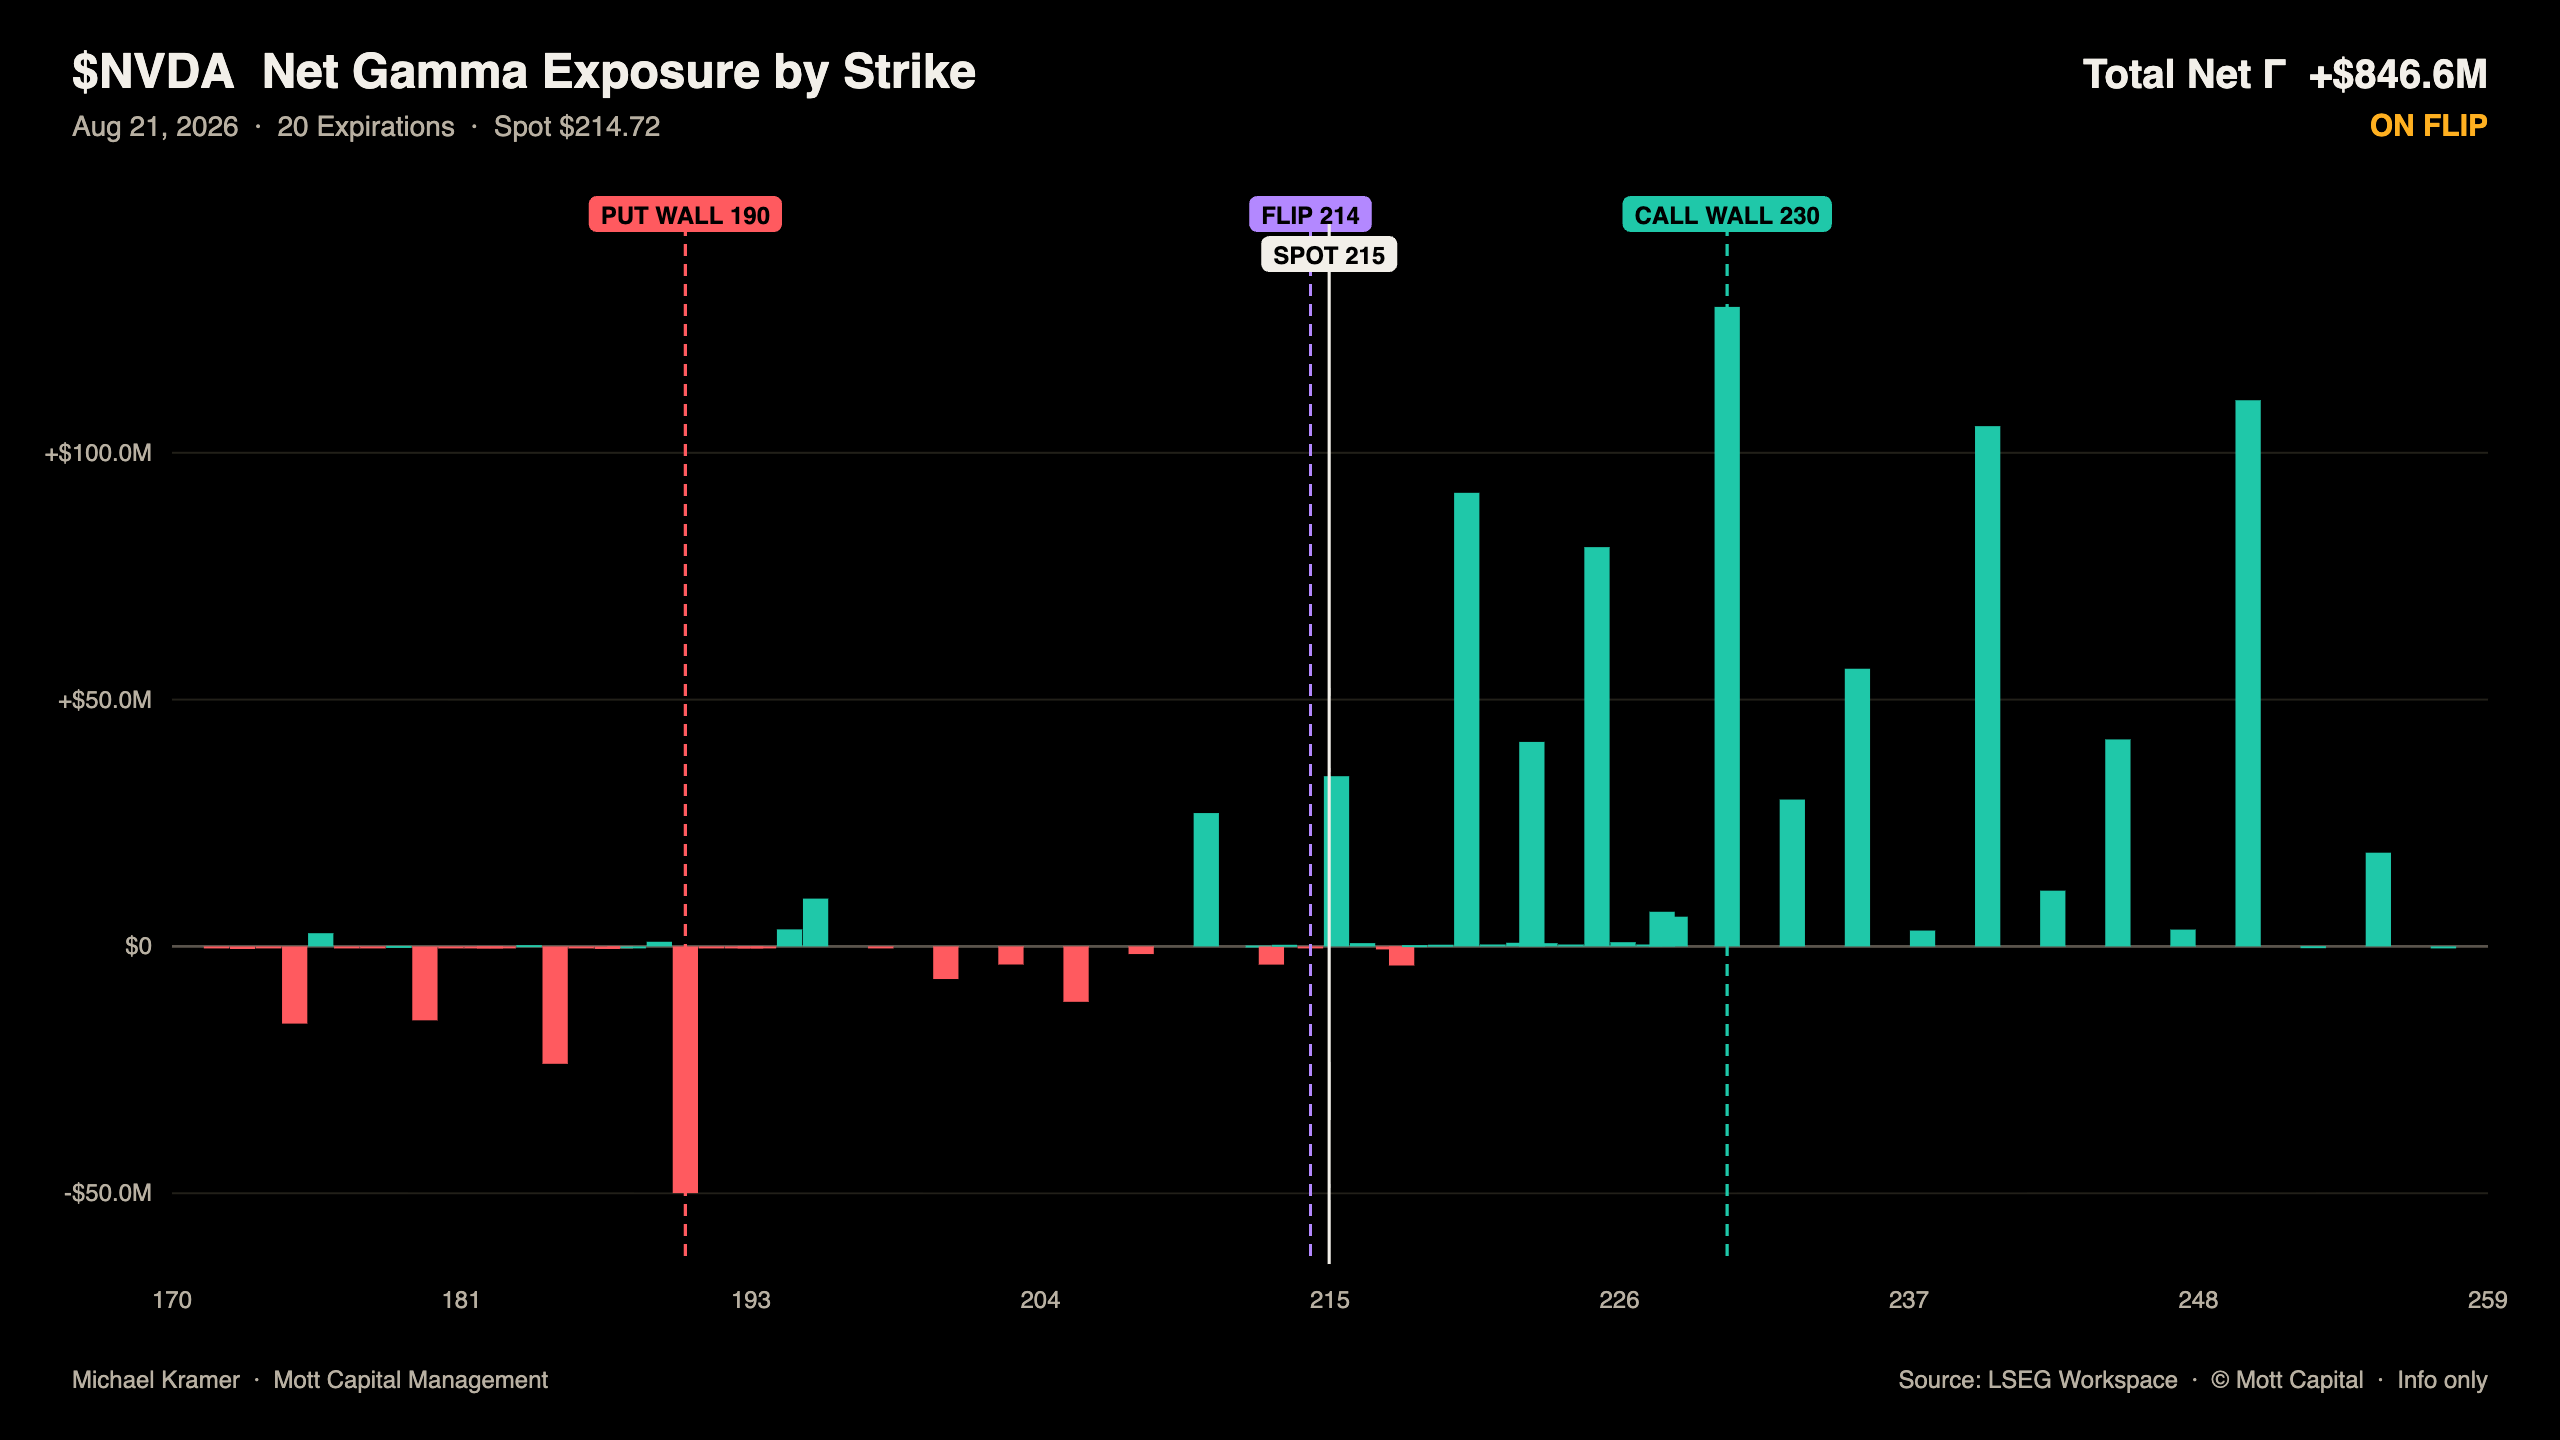
On the chart, $230 has been clear resistance, $212 clear support. Below $210 there is not much until around $190. The options market explains why. Nvidia sits in a positive gamma regime – the call wall at $230, the put wall at $190, the flip level around $214. That flip level roughly coincides with the $212 support. At this point the technical chart is really just reflecting the options market.
In this regime, dealer hedging pushes back against rallies and may buy dips, supporting the stock. What matters is how close spot sits to the flip zone. If the stock gets too far below it, say under $210, gamma could turn negative. Hedging flows would become directional. A post-earnings decline could see market makers push the stock toward the put wall around $190, with more volatility. The gamma profile shows resistance at $220, $225, $230, and even $240. On the put side there is little until $190 and then $185, with a gap to fill around $180 below that.
The charts suggest limited upside and asymmetric downside risk. The delta picture says the same: a lot of positive delta has been built up above the $220 strike, and calls outnumber puts by a wide margin. Once the company reports and implied volatility falls, if the stock cannot get above those upper gamma levels, that delta will lose premium and decay quickly. It could become for sale, helping push the stock lower.
A beat would not be a surprise given Nvidia's history. This quarter the options market is looking for about a 6% move, a mark the stock has exceeded only once recently, back in its fiscal fourth quarter of 2025. Anyone looking for big upside through options may not get rewarded here.
The VIX looks too low as bond volatility begins to stir. Rates keep moving higher. Thirty-year yields rose about one and a half basis points this week despite Treasury Secretary Bessent's attempt to calm the market by talking up buybacks – a move that likely reflected poor liquidity in the long end. The ten-year made its highest weekly close since January 2025. The two-year is rising too. The same is happening in Japan, Korea, Germany, Italy, and the UK. With that global pressure on rates, it will be hard for the Treasury to contain the long end by raising buybacks from $2 billion to $4 billion. That is borrowing more at the front to shore up the back end, smoke and mirrors rather than quasi-QE. It likely does not cap rates.
The dollar has come back, bouncing right at the 78.6% retracement. Hard to say whether that is a sustained reversal or just a retracement. If rates move up more dramatically and the Fed starts signaling hikes, the dollar probably strengthens. If the Fed sits on its hands, the long end likely rises further, and the dollar keeps weakening.
This is an asymmetric setup. The stock probably does not get high enough to reward the call buyers, and because we are so close to the flip zone, there is a chance it slips into negative gamma and trades toward $190. It need not happen in the first twenty-four hours. By Friday's expiration the stock could be at lower levels. That matters for the Nasdaq, where support sits around 28,900, the July support level, and for the S&P 500, where 7,600 has been an important level.
The NVDA stock page shows the stock at $214.72, down 0.98% on the day, with an Alpha Score of 73.