Retail sales rose 0.9% in July from June and 5.2% year over year, to $784 billion, on the Census Bureau's not-seasonally-adjusted basis. The seasonally adjusted total came to $763 billion, a 0.6% decline from June, with the year-over-year gain at 5.0%.
Ecommerce sales fell 2.0% from June, to $135 billion, after Amazon Prime Day lifted June sales to $138 billion. The year-over-year comparison has a timing quirk. July 2025 had Prime Day. July 2026 did not. Wolf Street called the 6.2% annual gain, measured against that larger base, a sign of strength. In August 2025, ecommerce sales dropped 4.4% from the Prime Day month. This July, the decline from June was 2.0%, and sales still came in above May's level. Wolf Street described the smaller drop as confirmation that online buying is holding up.
Ecommerce now stands as the largest retail category on a 12-month basis, with 18% of total retail sales. The total includes online operations of brick-and-mortar chains such as Walmart, Macy's, Costco, and Target. Grocery purchases are migrating online too.
Restaurants and bars, a direct gauge of discretionary spending, jumped 1.8% in July and 6.0% year over year, to $107 billion. Seasonally adjusted sales rose 0.5%. The annual increase ran well ahead of CPI inflation for food away from home, which was 3.4%. Food services and drinking places are the third-largest retail category, with 12% of total sales.
Motor vehicle dealers posted a 0.6% monthly gain and a 2.0% year-over-year gain, to $135 billion on a not-seasonally-adjusted basis. Seasonally adjusted sales totaled $129 billion, down 2.0% from June. Vehicle price inflation has provided little help. Used-vehicle CPI fell 0.2% from June and 1.8% year over year. New-vehicle prices slipped slightly in July and were up 0.5% year over year. Dealers, the longtime largest retail category, have been overtaken by ecommerce, with their 12-month share at 17%.
Food and beverage store sales bounced 4.6% in July and rose 1.7% year over year, to $88 billion. Seasonally adjusted sales have been flat for four months. The 1.7% gain trails CPI inflation for food at home, which ran 2.7%. Grocery spending has drifted toward general merchandise chains and online sellers for years, and restaurant spending overtook food-store spending in 2019. The gap has widened since.
General merchandise stores, which capture brick-and-mortar food sales at Walmart and Costco, jumped 2.1% in July and 4.5% year over year, to $80 billion. Seasonally adjusted sales rose 0.3%. The category is the fifth-largest, with a 10.5% share of total retail sales. Walmart's online grocery business is counted in the ecommerce total.
Gas station sales jumped 1.6% in July and 16% year over year, to $65 billion. July sits in peak driving season, and gasoline prices spiked from March through mid-May before easing. Seasonally adjusted gas station sales fell 0.9%.
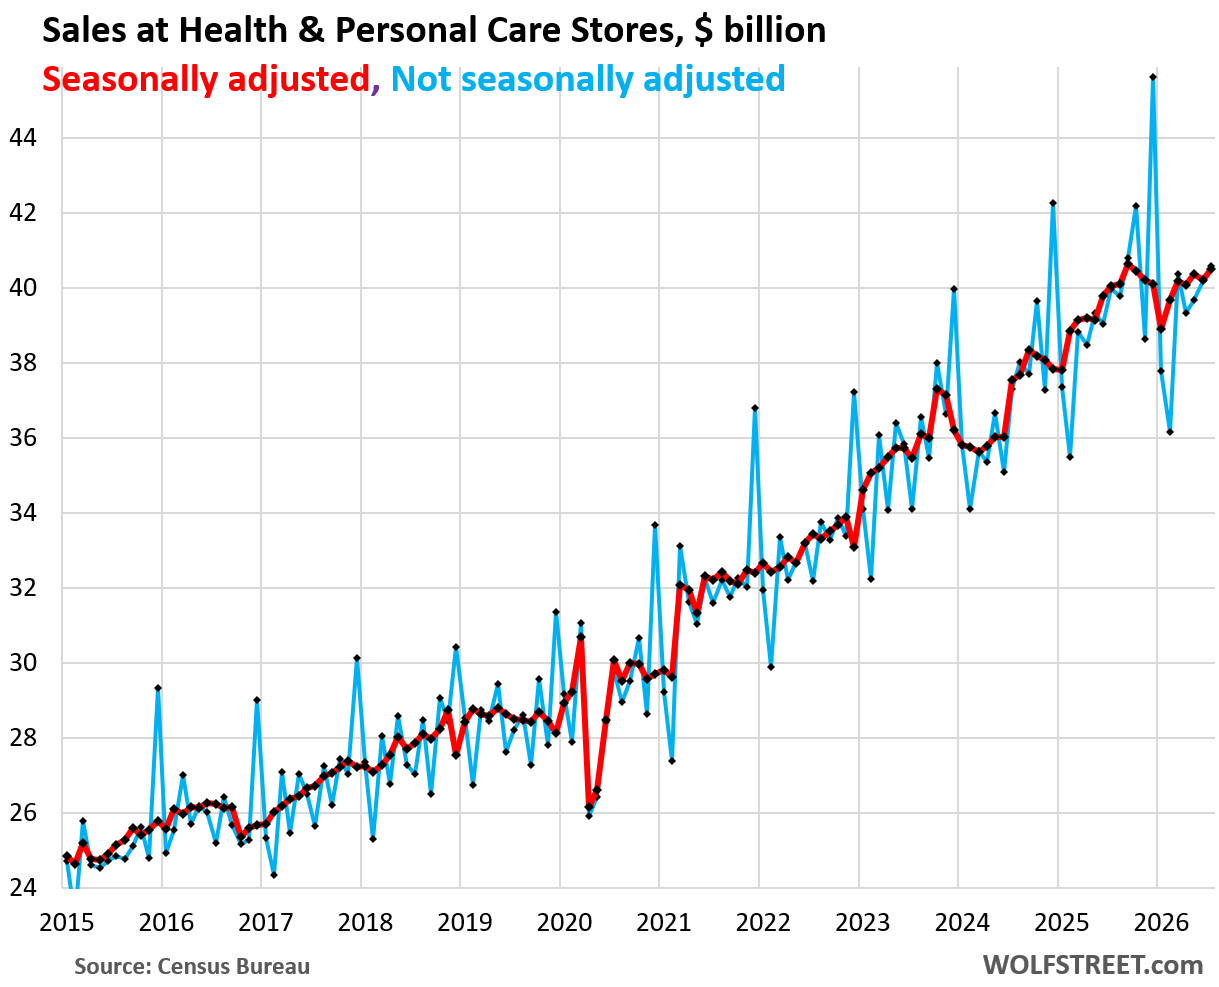
Smaller categories moved in different directions. Building materials and garden supply stores fell 4.4% from June, with a 5.9% year-over-year gain, to $42 billion. Health and personal care stores rose 1.0% in July and 1.5% year over year, to $41 billion. Clothing and accessory stores jumped 7.0% month to month and 5.4% year over year, to $28 billion. Miscellaneous store retailers fell 3.1% from June's record, then showed an 11.6% year-over-year gain, to $17.5 billion.
Seasonal adjustment complicates the month-to-month read. The Census Bureau's X-13 ARIMA-SEATS program strips out weather patterns and holiday buying. Trading-day effects also get adjusted, a necessary step given that many retailers operate seven days a week and ecommerce never closes. Not-seasonally-adjusted sales always spike in December and drop sharply in January and February; the adjustment process is what makes monthly comparisons meaningful. Over a 12-month period, the adjustment factors sum to zero, so a distortion in one month corrects in another.