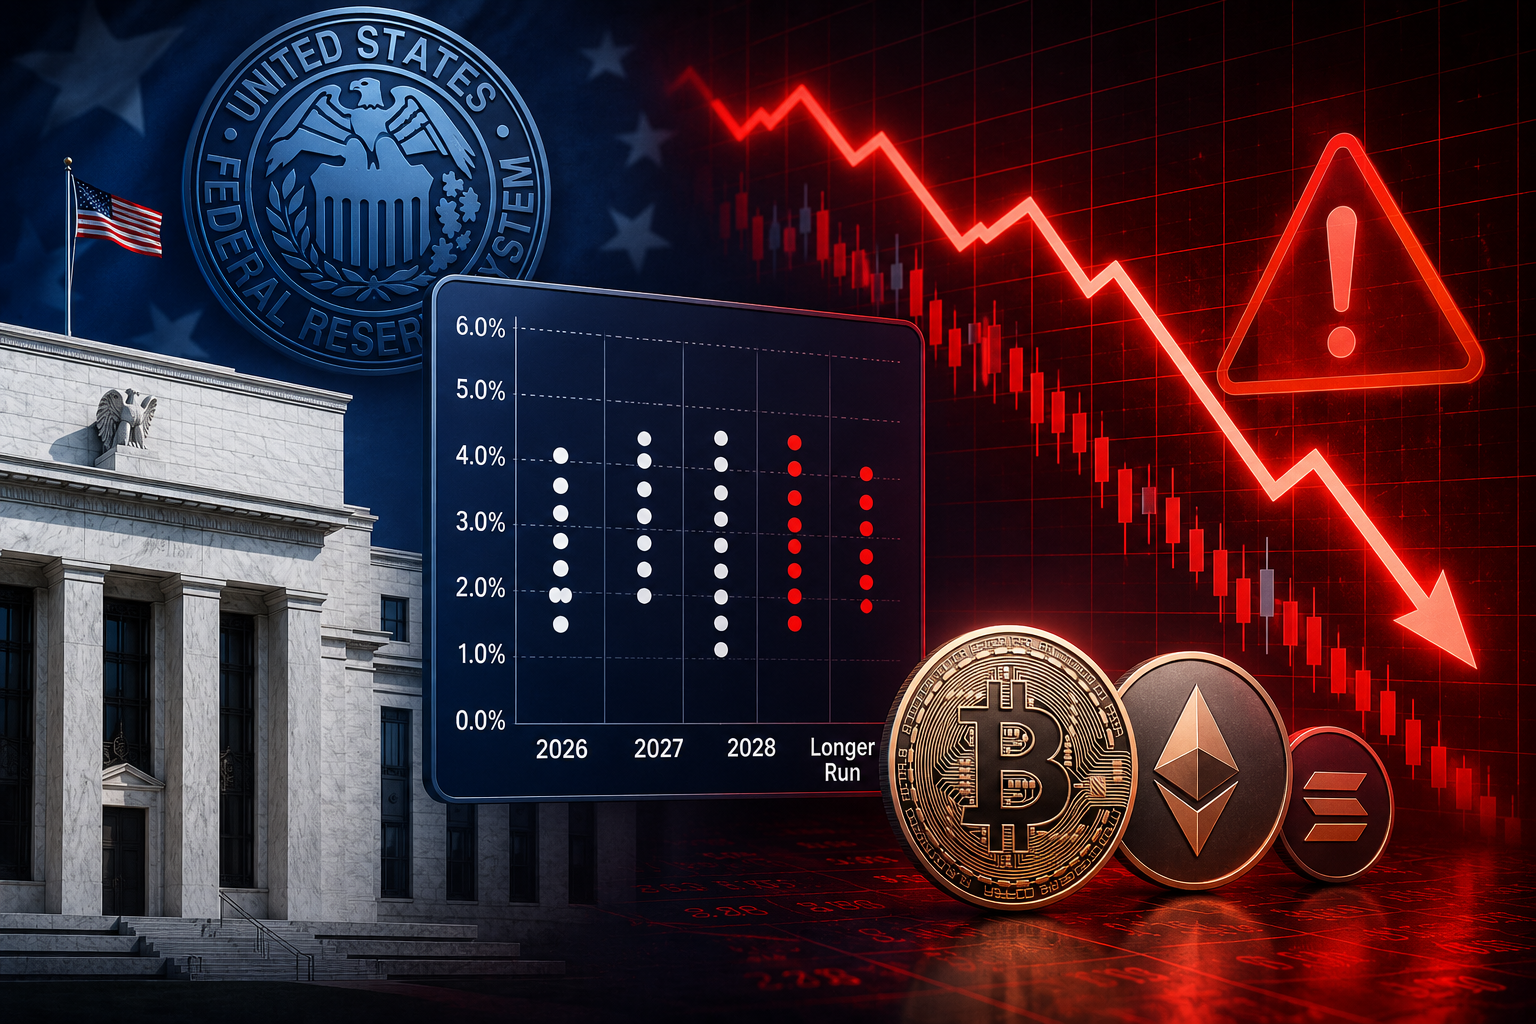
The Federal Reserve's June 2026 dot plot surprised markets. The median rate projection for year-end 2026 rose from the March level, according to the summary of economic projections released after the June 17 meeting. The shift implied one additional quarter-point hike this year. Before the meeting, fed funds futures assigned a low probability to such a move, CME data showed. The new median projection implies a higher terminal rate for 2026, according to the SEP.
Bitcoin fell sharply. The largest cryptocurrency dropped to its lowest in two weeks, according to CoinDesk. Ether and other altcoins also declined. The broader crypto market cap lost tens of billions in value on the session, CoinGecko data showed.
The dollar rose. The Bloomberg Dollar Spot Index gained. Two-year Treasury yields climbed. Higher real yields reduce the appeal of non-yielding assets like Bitcoin. The dot plot's hawkish tilt tightened financial conditions.
The simple read is that the Fed pushed back against rate-cut expectations. The better read involves positioning. Before the meeting, speculative longs in Bitcoin futures had built up to levels not seen in months, CFTC data showed. The hawkish surprise triggered a unwind of those positions. That amplified the selloff. The move was also exacerbated by low liquidity, with many traders on the sidelines ahead of the meeting.
The technical picture worsened. Bitcoin had been trading in a narrow range for weeks. The dot plot broke that range to the downside. A key support level gave way, accelerating the decline. Stop-loss orders contributed to the momentum.
The broader equity market also fell. The S&P 500 dropped, though the decline was smaller than in crypto. The divergence highlights crypto's higher beta to changes in rate expectations.
The policy statement was unchanged from May, repeating that the committee remains data-dependent. The dot plot carried the weight.
Liquidations increased across crypto derivatives exchanges, Coinglass data showed. The futures basis flattened, indicating reduced demand for leveraged long exposure. The selloff was orderly but sharp, catching some traders who had positioned for a dovish outcome. Stablecoin trading volumes increased, reflecting a risk-off shift, according to CoinMarketCap data.
The next catalyst is the June CPI report, due in mid-July. It will show whether inflation is following the path the dot plot assumed. The market will adjust accordingly. The July FOMC meeting is scheduled for July 28-29.