Gold price prediction: $5,200 bull vs $3,900 bear, time to buy?
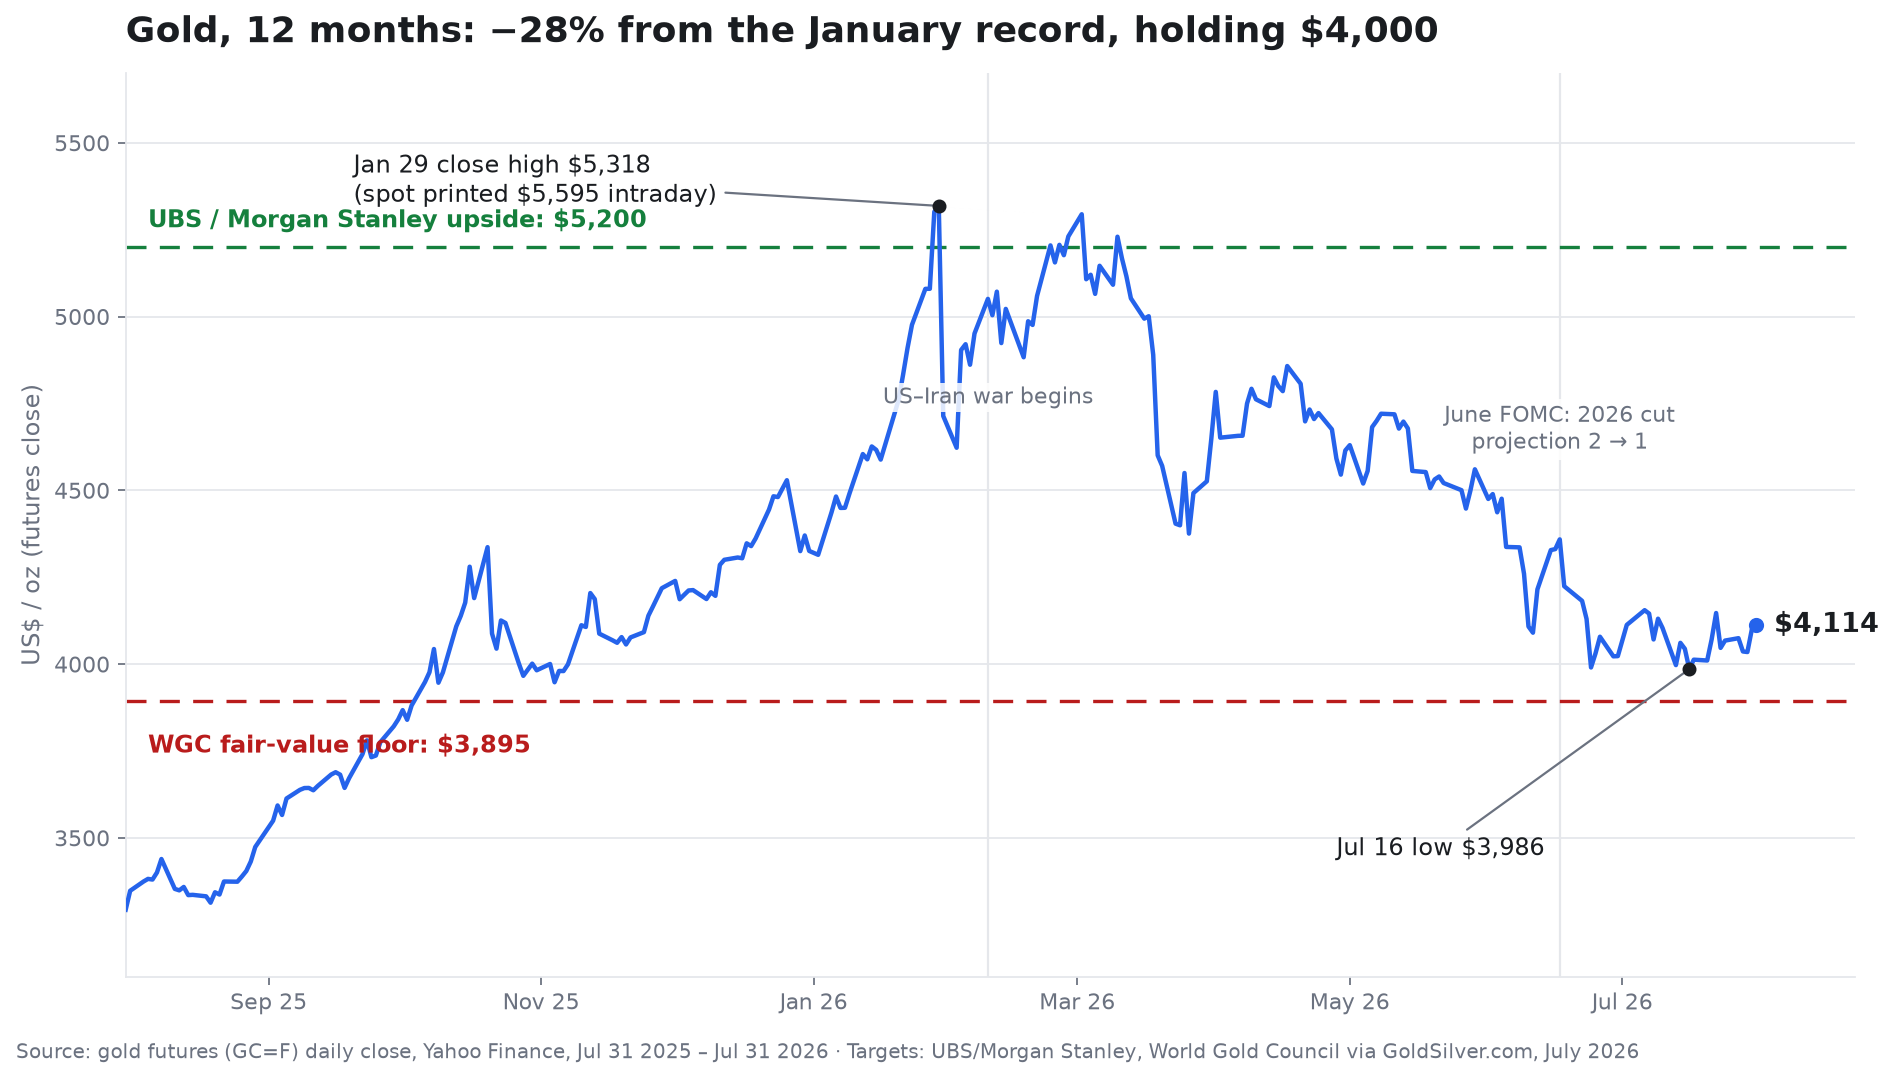
Gold trades near $4,050 after a 28% drawdown from January's record. Central bank buying and fair-value support create a buy-the-dip case, but a hawkish September FOMC poses the biggest risk.
Gold fell 28% from its January 29 intraday record of $5,595.47, the steepest quarterly decline in 13 years. It now trades near $4,050, roughly 25% higher than a year ago and within 4% of the World Gold Council's own fair-value estimate, according to GoldSilver's July outlook. The decline is not a crash story like silver's 52% drawdown; it is a rotation story. The January melt-up priced two things at once: war risk and imminent Federal Reserve easing. The war arrived in February and gold initially held its bid. What broke the price was the second assumption failing. Hormuz pushed oil and then US inflation (4.2% by May) high enough that the Fed's June projection went from two 2026 cuts to one. Real yields, gold's true opportunity cost, rose. Western investment demand left first: ETF holdings saw significant selling through May and June and remain below their pandemic-era peak.
Gold's marginal buyer divides into two groups. Rate-sensitive Western ETF allocators sold hard from May. Rate-insensitive central banks, led by the People's Bank of China, kept buying. The PBOC added 14.93 tonnes in June, its twentieth consecutive monthly purchase and its largest single addition since October 2023. Global central banks have been absorbing roughly 1,000 tonnes a year since 2022. "Geopolitical tensions continue to drive strong central bank demand for gold," European Central Bank President Christine Lagarde has observed, per GoldSilver's roundup. This demand does not read the dot plot. It is reserve diversification driven by sanctions risk and dollar-weaponisation concerns, and it accelerated into the drawdown. China is buying every gold dip, and the Shanghai premium has normalised to $3-$6 after the paper-gold ban, a physical market clearing in an orderly way.
Silver's crash had no rate-insensitive buyer waiting underneath it. That is why the gold-silver ratio blew out to 69:1, the top of its 50-year range, and why gold's 28% drawdown found a floor 4% under spot while silver's 52% drawdown is still searching for one. Central banks do not buy silver; they buy gold. The structural picture separates the two metals sharing this correction.
Three separate times in July, gold probed the $4,000 area and bounced. The July 29 FOMC, hawkish as its 9-3 vote with three hike-dissents was, produced no new low; futures closed July at $4,114. A market that absorbs its worst policy backdrop in a decade without breaking its floor is telling you where the marginal rate-insensitive bid lives.
The quantitative case for buying the dip rests on asymmetry. Goldman Sachs analysts see $4,900 as their base case. JPMorgan cut its target from $6,000 to $4,500 on July 3. UBS and Morgan Stanley project $5,200 upside. The World Gold Council's fair-value floor sits at $3,895, about 4% below spot. After JPMorgan's revision, the remaining $700 spread between JPMorgan and UBS is a disagreement about ETF flows returning, not about the floor. That asymmetry – roughly 4% modelled downside against 11-28% upside – is the core of the buy-the-dip case, and it did not exist in January, when spot traded $1,300 above the WGC's own fair-value band.
State Street Global Advisors' July framework assigns a 70% probability to a $4,750-$5,500 range over the next six to nine months, a view that spans the bull case without requiring new highs. The drivers that produced the 2024-2026 bull run remain in place: central bank reserve diversification near 1,000 tonnes a year, a US fiscal trajectory no committee vote changes, and early signs of institutional allocators treating gold as a strategic rather than tactical holding. What has changed is the starting valuation. A long-term accumulation programme begun inside the WGC's fair-value band compounds from fundamentals, where one begun at January's $1,300 premium to fair value was compounding from sentiment.
The case for waiting is the calendar. The same September FOMC that governs silver call governs this one. Three FOMC members just voted to hike, and Goldman's $4,400-on-a-hike scenario tells you a genuine tightening surprise still costs gold its floor test. The 200-day average overhead in the $4,340-$4,491 band is the technical ceiling any rally must reclaim before trend-followers return. A hot August inflation print would push real yields against the position again. Buying below fair value is not the same as buying at the low.
Our base case has gold at $4,500 by December 31, 2026, JPMorgan's revised Q4 number, on one delivered Fed cut, continued 1,000-tonne-pace central bank absorption, and ETF flows stabilising rather than reversing. The bull case is $5,200, the UBS and Morgan Stanley upside, and requires the ETF bid to actually return, which historically follows the first cut rather than preceding it. The bear case is $3,900, the WGC fair-value floor, on a September hawkish surprise or a hike. A weekly close below $3,895 would put gold below fair value for the first time in this cycle and invalidate the basing thesis.
Watch, in order: the September FOMC dots; monthly PBOC reserve data (a 21st consecutive purchase keeps the floor story intact); ETF flow direction into Q4; and the gold-silver ratio, where a decisive move back under 65 would confirm the monetary bid broadening. For long-horizon allocators, the 28% drawdown is the feature, not the bug. The path through the September FOMC will decide whether the entry gets cheaper still.
Drafted by a large language model from the source reporting linked above, then screened by automated publishing checks. It is not read by a journalist before publication. Some articles cite our Alpha Score. Verify prices and figures against the original source. Educational coverage, not personalized advice.