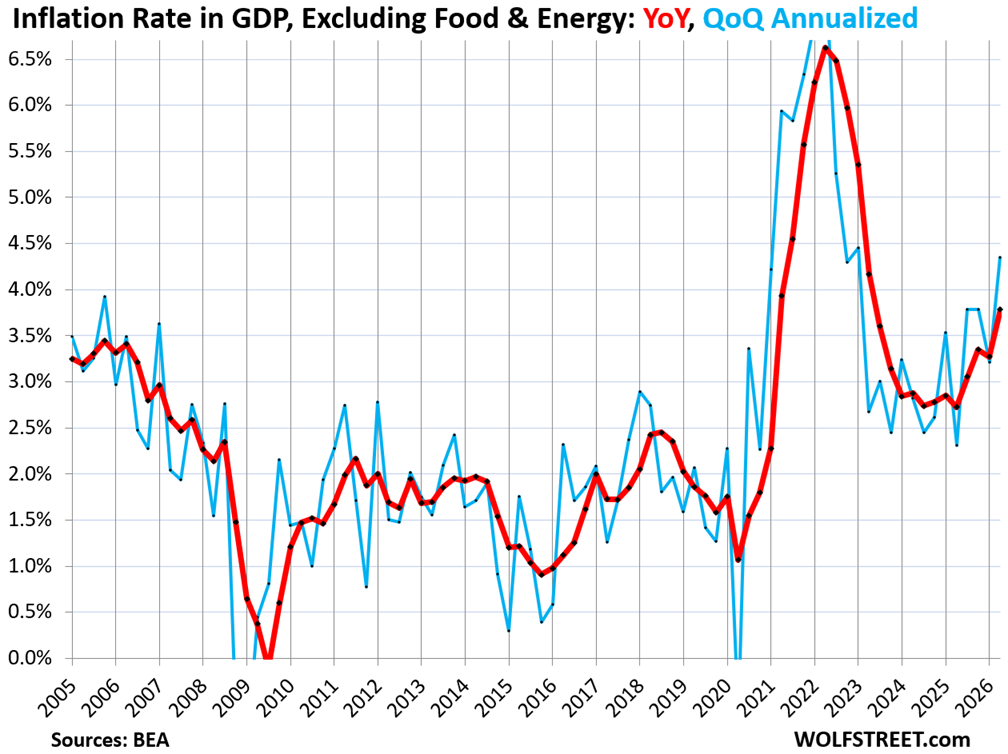
The Bureau of Economic Analysis released its quarterly GDP accounts Thursday, and the inflation data across the entire U.S. economy was grim. The GDP deflator – which tracks price changes in every good and service bought by consumers, businesses, and governments – rose 6.3% on an annualized basis in the second quarter from the first. That was the fastest quarterly increase since Q2 2022.
Year-over-year, the GDP deflator climbed 4.3%, the highest since Q1 2023. Both the quarterly and annual rates have accelerated for four consecutive quarters, according to the BEA data.
Energy prices spiked early in Q2 before retreating midway through the quarter. The core GDP deflator, which strips out energy and food, rose 4.4% annualized in Q2, the worst quarterly increase since Q1 2023. Year-over-year, core GDP inflation ran at 3.8%, also the worst since Q2 2023. These are not consumer-focused measures. They cover the whole economy, including government purchases and business investment. Businesses and governments face even higher inflation rates than consumers, which lifts the headline deflator above the consumer price gauges.
The Federal Reserve does not target the GDP deflator. Its preferred yardstick is the PCE price index, a consumer-only subset of the same GDP accounts. The quarterly PCE price index jumped 5.1% annualized in Q2, the second largest quarterly increase since Q1 2022. Year-over-year, the PCE price index rose 3.8%, the worst since Q2 2023. The core PCE price index, excluding energy and food, rose 3.4% annualized in Q2, the second worst quarter-to-quarter increase since Q1 2024. Year-over-year, core PCE ran at 3.3%, the highest since Q2 2023. The acceleration away from the Fed's 2% target began a year ago.
Bond markets reacted quickly. The 30-year Treasury yield hit its highest level since 2007, a signal that traders expect the Fed to keep rates elevated for an extended period. The dollar index strengthened as the yield advantage widened. The S&P 500 slipped, with rate-sensitive growth stocks leading the decline. Gold, which tends to come under pressure when real yields rise, edged lower.
The next hard data point is the July CPI report due Aug. 13. The Fed's next policy decision is Sept. 20.