The US Dollar has reclaimed early-week losses, carving out a double-bottom pattern on the daily charts that signals a shift in market sentiment. This technical formation coincides with a sharp resurgence in energy prices, as WTI Crude oil pushed back above the $105 level. For traders, the transmission mechanism is clear: the breakdown of ceasefire negotiations in the Middle East is forcing a repricing of risk, which in turn acts as a catalyst for the greenback through the petrodollar channel.
The Geopolitical Transmission Path
The immediate driver of this volatility is the collapse of diplomatic progress in the Middle East. Reports from the semi-official Fars Agency indicate that Iranian forces launched missile strikes against US Navy vessels in Iranian waters, alongside drone operations targeting the UAE. This escalation has effectively nullified the recent ceasefire, forcing market participants to abandon the hope of a de-escalation trade. The US military, in coordination with Israeli counterparts, is reportedly evaluating limited response options. This uncertainty creates a direct bid for the dollar as a safe-haven asset, while simultaneously pressuring energy markets.
When WTI Crude trades above $105, the inflationary impulse is immediate. Fed Governor Williams, a key voting member of the Federal Open Market Committee, recently highlighted concerns regarding the impact of sustained energy price increases on the broader inflation outlook. While Williams attempted to dampen the market's reaction to potential hawkish dissents regarding future rate hikes, the underlying reality remains: higher energy costs complicate the Fed's policy path. If WTI Crude sustains momentum toward the $110 threshold, the petrodollar correlation will likely tighten, providing a structural floor for the DXY that technical patterns alone cannot explain.
Technical Levels and Moving Average Mechanics
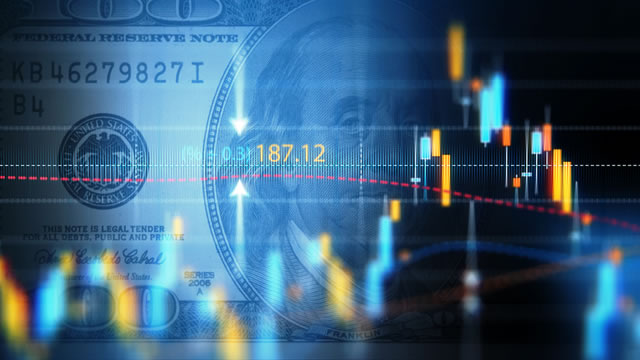
The DXY is currently testing the 98.50 level, which aligns with the 200-day moving average. This is a critical juncture for trend confirmation. The index is effectively pinned in the middle of its July 2025 range, which spans from 96.00 to 100.00. The flattening of daily moving averages reflects a broader state of indecision, as the market struggles to reconcile the cooling of domestic economic data with the heating of geopolitical risk premiums.
On the 4-hour timeframe, the index is interacting with the top of a downward channel and the 50-period moving average. Sellers have attempted to defend these levels, but the lack of follow-through momentum suggests that the market is waiting for a definitive headline regarding the US-Israel response to the Iranian strikes. A clean break above the 98.50 resistance would invalidate the recent bearish channel and likely trigger a move toward the 100.00 psychological barrier.
Evaluating Risk-Reward in Major Pairs
For those navigating the forex market analysis, the current environment demands a focus on pairs that exhibit high sensitivity to both energy prices and US yield differentials. The EUR/USD profile and GBP/USD profile remain the primary vehicles for expressing a view on dollar strength. Because the dollar's current rally is driven by geopolitical risk rather than a shift in domestic interest rate expectations, traders should be wary of over-leveraging based on yield differentials alone.
As noted in our Middle East Conflict and UK Politics Drive GBPUSD Volatility analysis, the interplay between energy-importing economies and the dollar is asymmetric. Europe and the UK are more vulnerable to the inflationary shock of $105+ oil than the US, which provides a fundamental reason for the DXY to outperform in this specific regime. Traders should monitor the 98.50 level closely; a failure to hold this support would suggest that the market is discounting the geopolitical risk faster than the technicals currently imply.
AlphaScala Sentiment and Asset Positioning
Market participants should distinguish between tactical price action and structural shifts. While the DXY is forming a double bottom, the broader market remains in a state of flux. For instance, in the communication services sector, SPOT stock page currently holds an Alpha Score of 41/100, reflecting a mixed outlook that mirrors the broader equity market's hesitation. Similarly, SAFE stock page in the real estate sector carries an Alpha Score of 54/100, indicating that while some sectors are finding stability, the overall risk-on appetite remains fragile.
Ultimately, the next move in the dollar will be dictated by the severity of the military response in the Middle East. If the situation remains contained, the DXY may revert to its range-bound behavior between 96.00 and 100.00. If, however, the conflict expands, the petrodollar trade will likely override domestic Fed policy concerns, pushing the index toward the upper bound of its range. Traders should look for confirmation of this move through a sustained close above the 98.50 level on the daily chart.