Brent Retreats from $100 as Saudi Coalition Offer Eases Supply Risk
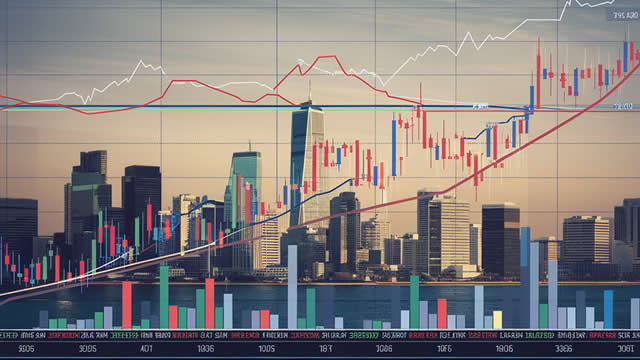
Saudi Arabia's maritime coalition proposal sent Brent crude below $100 as tanker traffic resumed. The technical setup shows a neutral RSI with support at $86.80 and resistance at $94.60.
Brent crude rose above $100 on 23 July after reports of attacks on tankers and infrastructure in the Red Sea and strong statements from Donald Trump toward Iran over shipping security through the Strait of Hormuz. The move proved short-lived. On 30 July, Saudi Arabia proposed creating a maritime coalition to protect key shipping routes. By 31 July, tanker traffic through the Strait of Hormuz had partially resumed, according to CNBC data. The Islamic Revolutionary Guard Corps claimed attacks on vessels under US escort. Western maritime authorities have not confirmed those claims.
The coalition proposal could reduce the geopolitical risk premium priced into crude if diplomatic progress continues. Shipping insurance rates for Red Sea transits, which spiked after the initial attacks, may begin to normalize. Iran's response to the coalition remains a wildcard; unconfirmed IRGC claims suggest Tehran is not backing down. The partial resumption of tanker traffic, while not full, marks a shift from the peak tension on July 23.
On the four-hour XBRUSD chart, the asset formed a short-term trend from early July, moving from around $71 toward the $102 area. The trendline broke, and the current market profile formed. The price now sits between the Point of Control zone at $92.20 and the upper profile boundary at $94.60. A breakout above that boundary could open the way toward the red resistance level at $98.50. If the price moves below the POC zone, the next area of interest is the cluster of two levels: the lower profile boundary at $86.80 and the green support level at $85.30.
The RSI plus moving averages indicator shows readings of 58, 51 and 51, with all oscillator values returning to the neutral zone after a period of elevated volatility. Trading volume remains relatively high, confirming continued market interest. The neutral RSI positioning suggests no clear directional momentum has emerged.
The next key level to watch is the lower profile boundary at $86.80. A break below that would open a move toward $85.30 support.
Drafted by a large language model from the source reporting linked above, then screened by automated publishing checks. It is not read by a journalist before publication. Some articles cite our Alpha Score. Verify prices and figures against the original source. Educational coverage, not personalized advice.