Back to Markets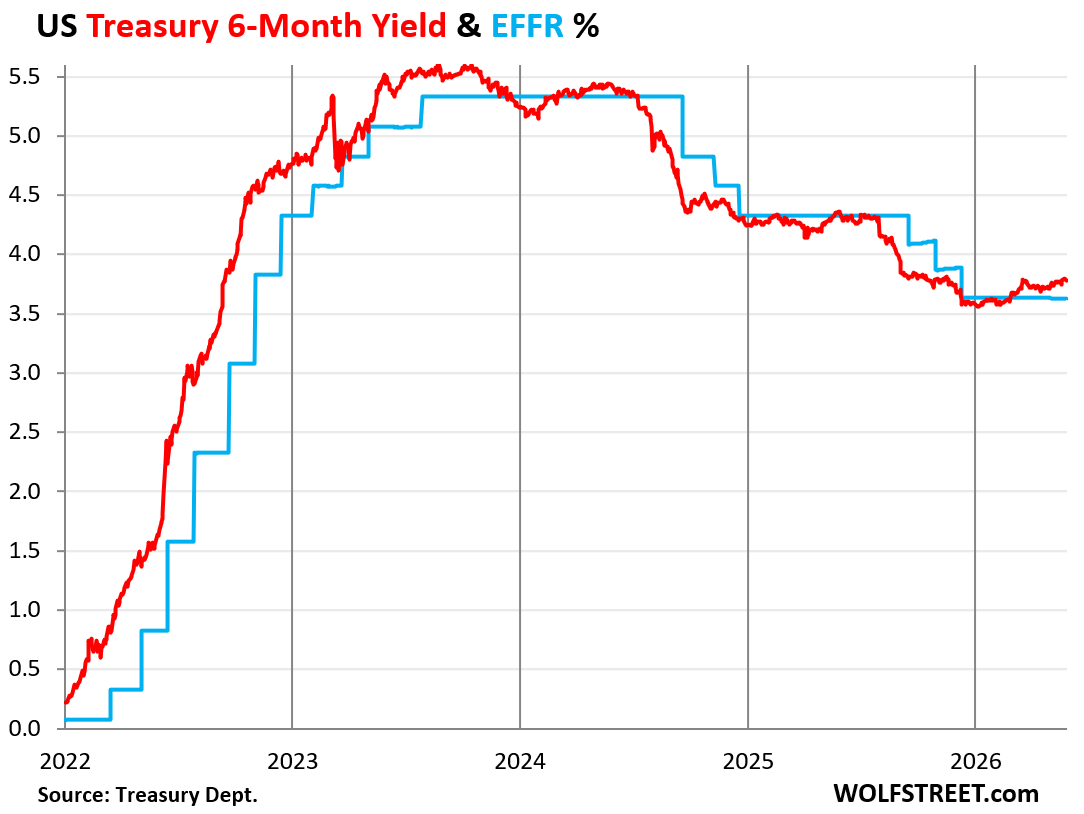
Macro● Neutral
Bond Market Prices Two Rate Hikes as T-Bill Yields Lag 3.8% Inflation
T-bill yields lag 3.8% inflation as Treasury sells $742B in securities. Bond market prices two rate hikes. Watch the 2-year yield and June FOMC dot plot.
Continue with
The US Treasury sold $742 billion of securities last week across 10 auctions, the heaviest issuance since January. Of that total, $504 billion were Treasury bills (4-week to 26-week maturities) and $238 billion were notes (2-year to 7-year). The surge ends a lull during tax season when the Treasury General Account (TGA) swelled above $1 trillion. The TGA has since dropped to $850 billion, below the desired $900 billion floor, forcing the Treasury to ramp up bill supply back to January levels.
The simple read: the government is refinancing maturing debt at a time when short-term yields are being outpaced by inflation. The better read: this auction cycle exposes a growing disconnect between the Fed's policy path and the bond market's inflation expectations, and the transmission through yields, the dollar, and risk assets is just beginning.
The $742 Billion Signal: T-Bill Yields Below Surging Inflation
Inflation accelerated further in April. The Fed-favored PCE price index hit 3.8%, nearly double the Fed's 2% target. The Consumer Price Index also printed 3.8%. Against that backdrop, T-bill yields have edged up but remain below inflation across all maturities.
- 4-week T-bill yield: ~4.25% (real yield negative ~0.45%)
- 13-week T-bill yield: ~4.30% (real yield negative ~0.50%)
- 26-week T-bill yield: ~4.35% (real yield negative ~0.55%)
Investors accepting negative real yields on short-term government debt is not new, the magnitude matters. The last time T-bill yields were this far below inflation was during the 2021-2022 ramp, before the Fed started hiking. The difference now: the Fed has already cut rates three times since September 2024, bringing the target range to 3.50-3.75%, and the Effective Federal Funds Rate (EFFR) to 3.63%.
The TGA Drain and Issuance Mechanics
The TGA balance dropped from over $1 trillion to $850 billion in a matter of weeks as the Treasury spent down cash. To replenish it, the Treasury must issue new bills. With the debt ceiling suspended through 2025, there is no artificial cap on supply. The $504 billion in T-bill auctions last week mostly rolled maturing bills, the net new issuance added pressure on short-end yields.
2-year Floating Rate Notes (FRNs) were sold at a spread of 0.103% over the 13-week T-bill yield, unchanged from a month ago. Buyers of these FRNs receive a weekly reset rate based on the most recent 13-week T-bill auction yield plus that spread. The fixed-rate 2-year note auctioned at 4.07%, the highest auction yield since February 2025, when the Fed's target range was still 4.25-4.50%. Back then, the 2-year auction yield (4.169%) was below the target range, implying future rate cuts – which came. Now the 2-year auction yield at 4.07% is above the current target range (3.50-3.75%), implying the bond market expects at least two rate hikes in the first portion of the two-year term.
Bond Market Pivots to Rate Hikes: What the 2-Year Yield Says
The 2-year Treasury yield has historically been a reliable predictor of Fed rate moves. Late last year, it pivoted from pricing more rate cuts to a hold. In March, it pivoted from a hold to pricing multiple rate hikes. Last week, the 2-year yield backtracked on steep prior gains, closing at 4.01%, that still implies a significant probability of hikes within the next two years.